Open your browser and go to wbsatmservices.com. You will be presented with the BlueVerse Terminal Total Management System login screen branded with the Wittenbach logo.
The login panel appears on the right side of the page with two fields: User ID and Password.
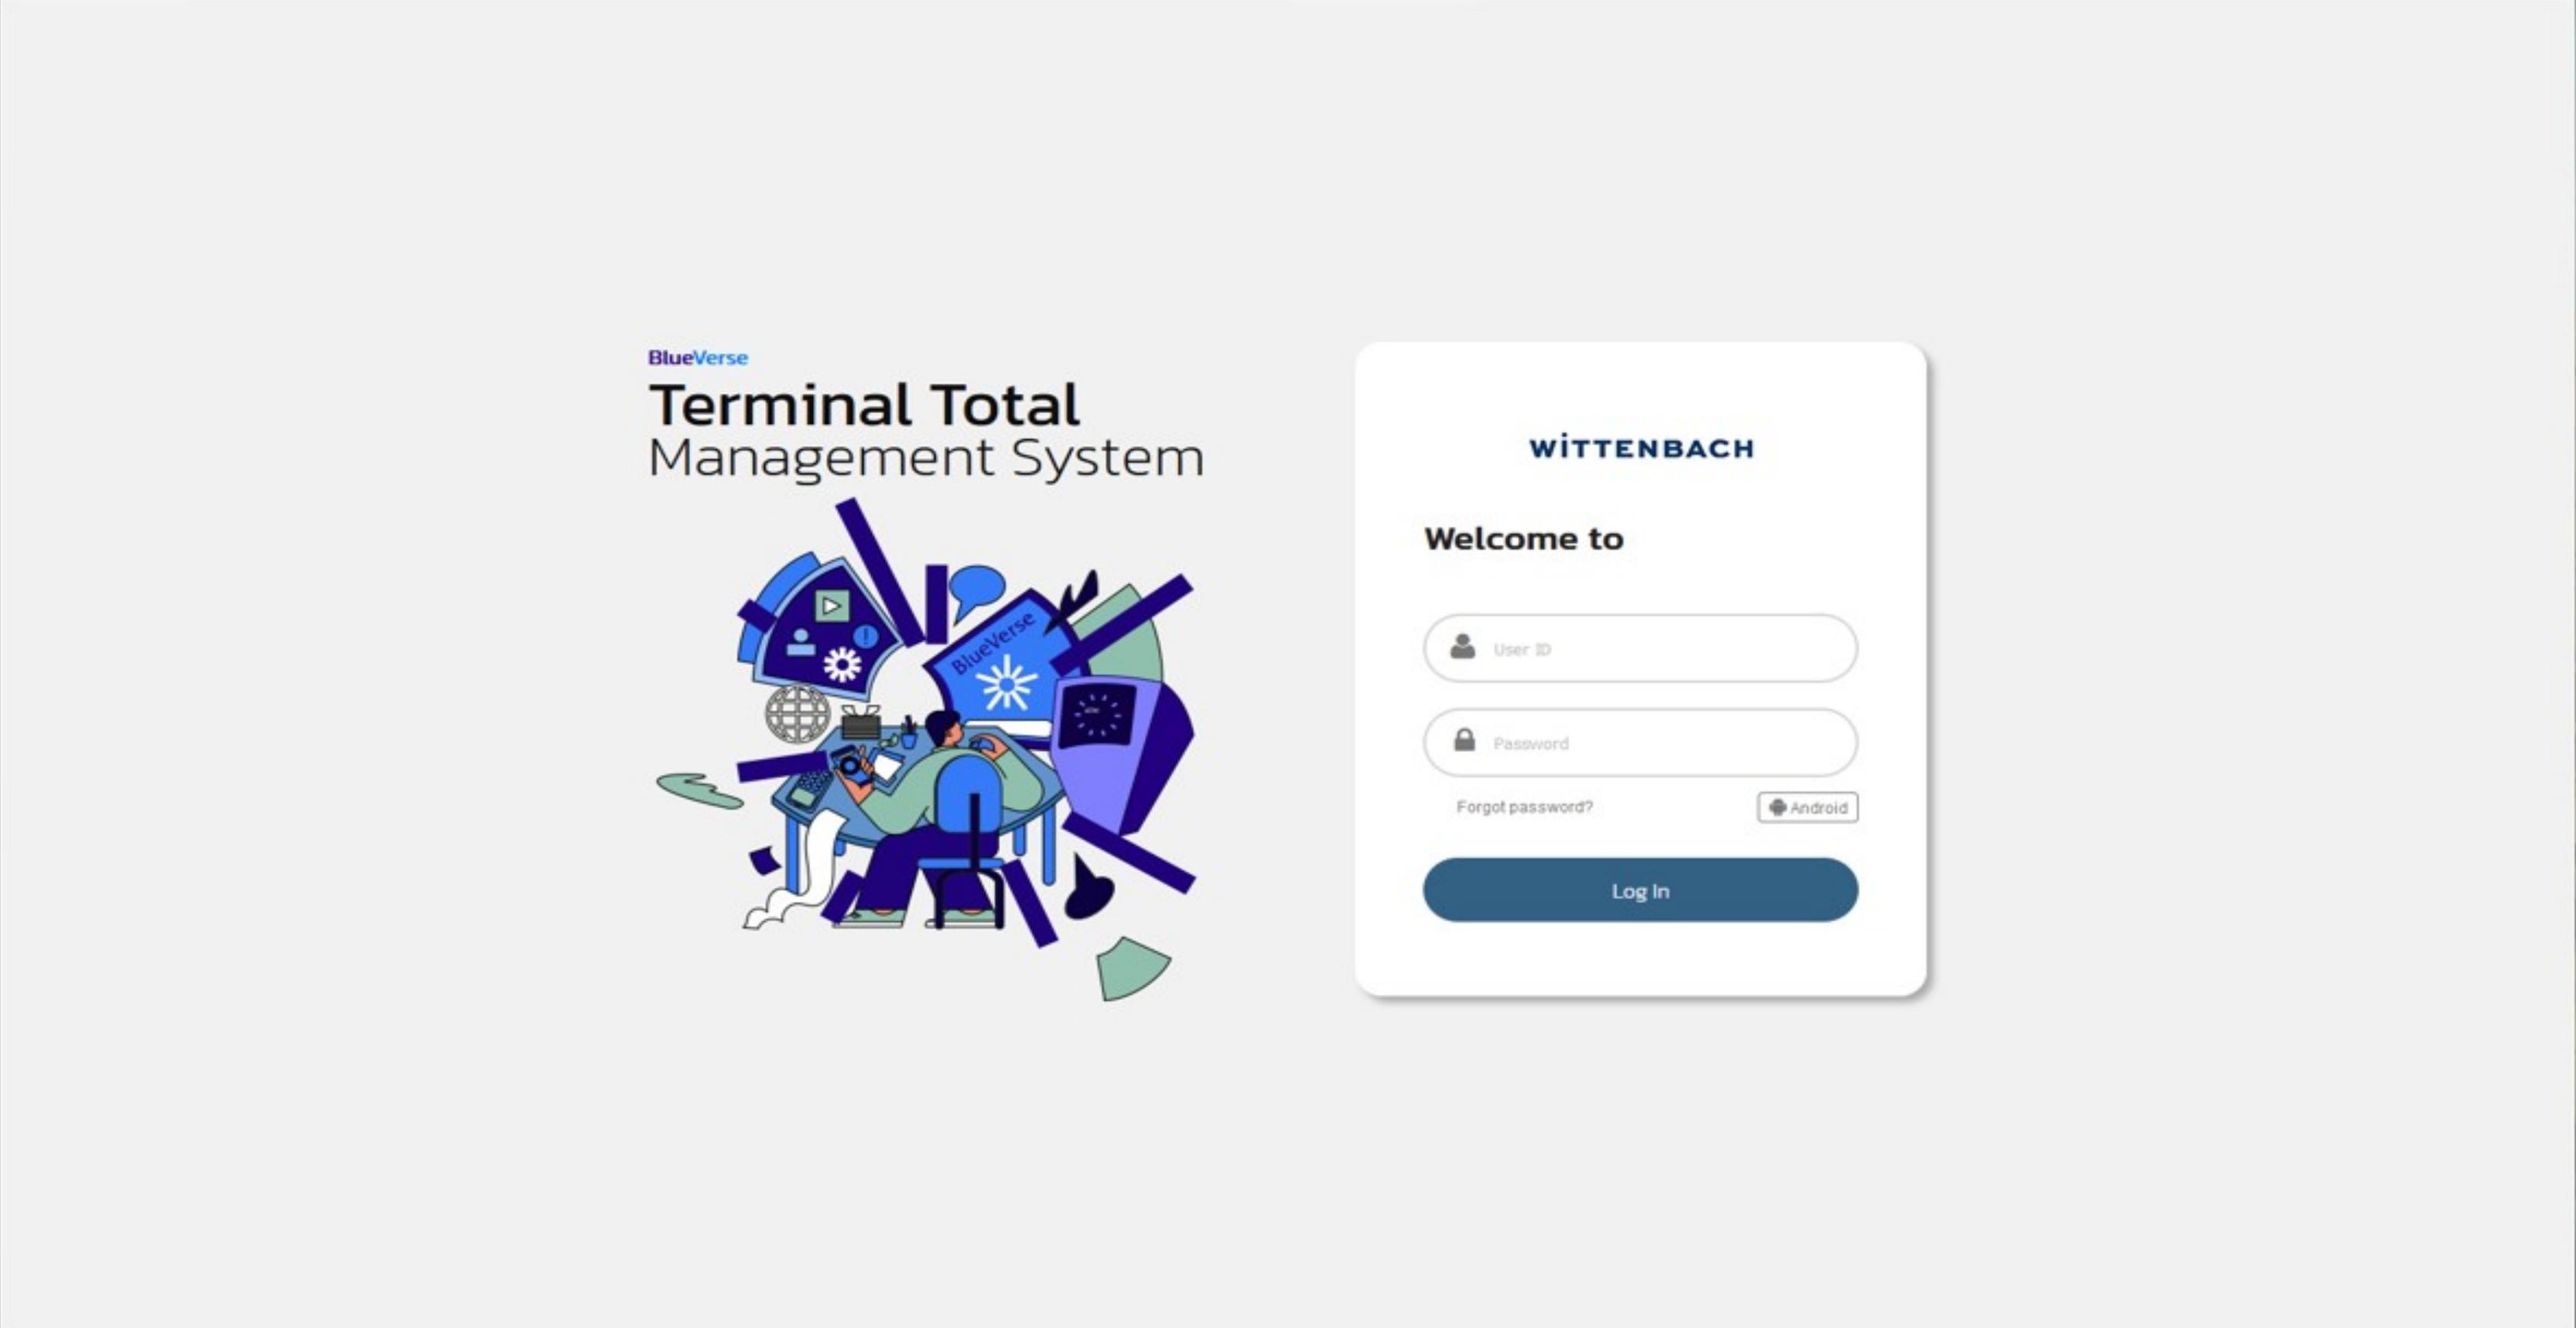
Enter your User ID and Password, then click Log In.
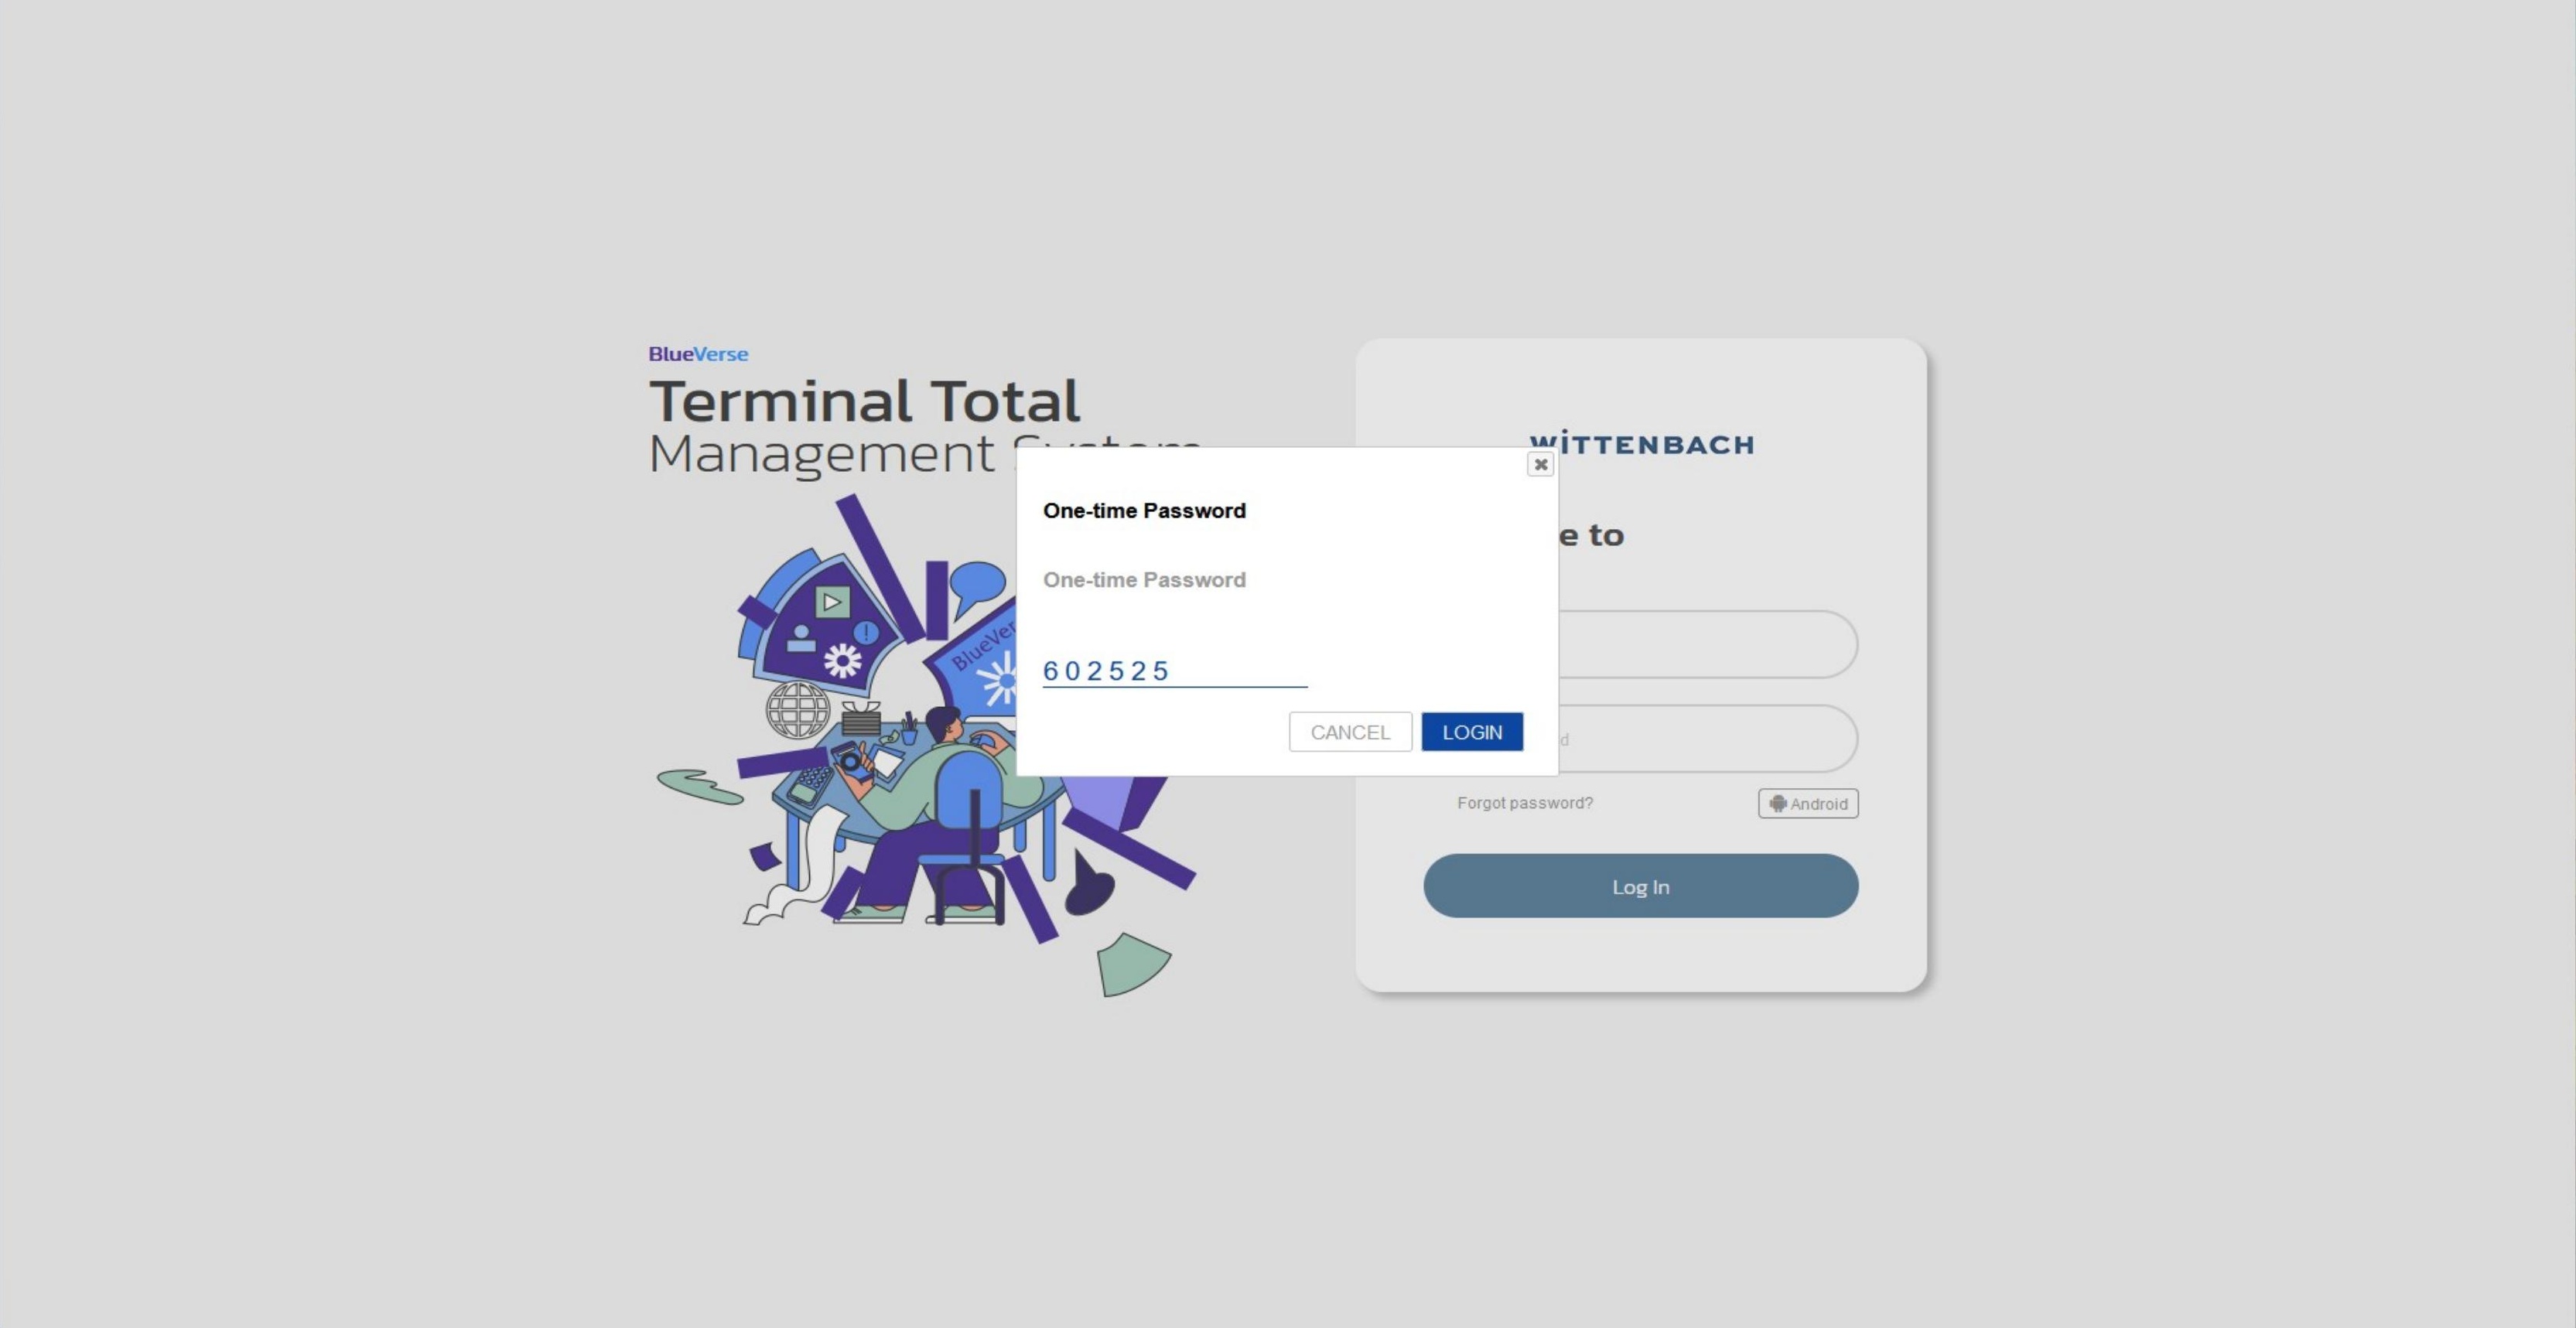
If multi-factor authentication (MFA) is enabled on your account, a One-time Password dialog will appear. Enter the 6-digit code sent to your registered device or authentication app, then click LOGIN.
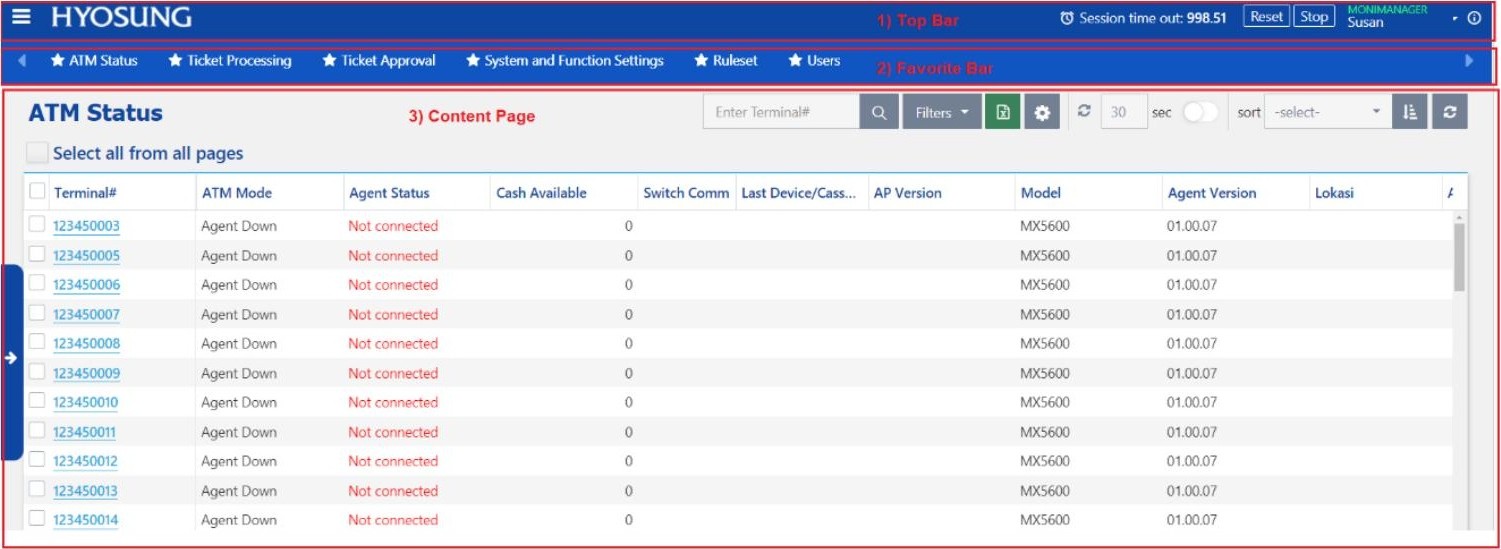
After successful authentication, you will land on the Terminal Status page.
Once logged in, the BlueVerse Fleet interface consists of four key areas:
| Area | Description |
|---|---|
| Top Bar | Always visible — contains your session timer, Reset/Stop buttons, username, and version info |
| Favorite Bar | Quick-access links to your most-used pages, shown below the Top Bar whenever a content page is open |
| Content Page | The main working area — displays whichever page you've navigated to (Terminal Status, EJ Viewer, etc.) |
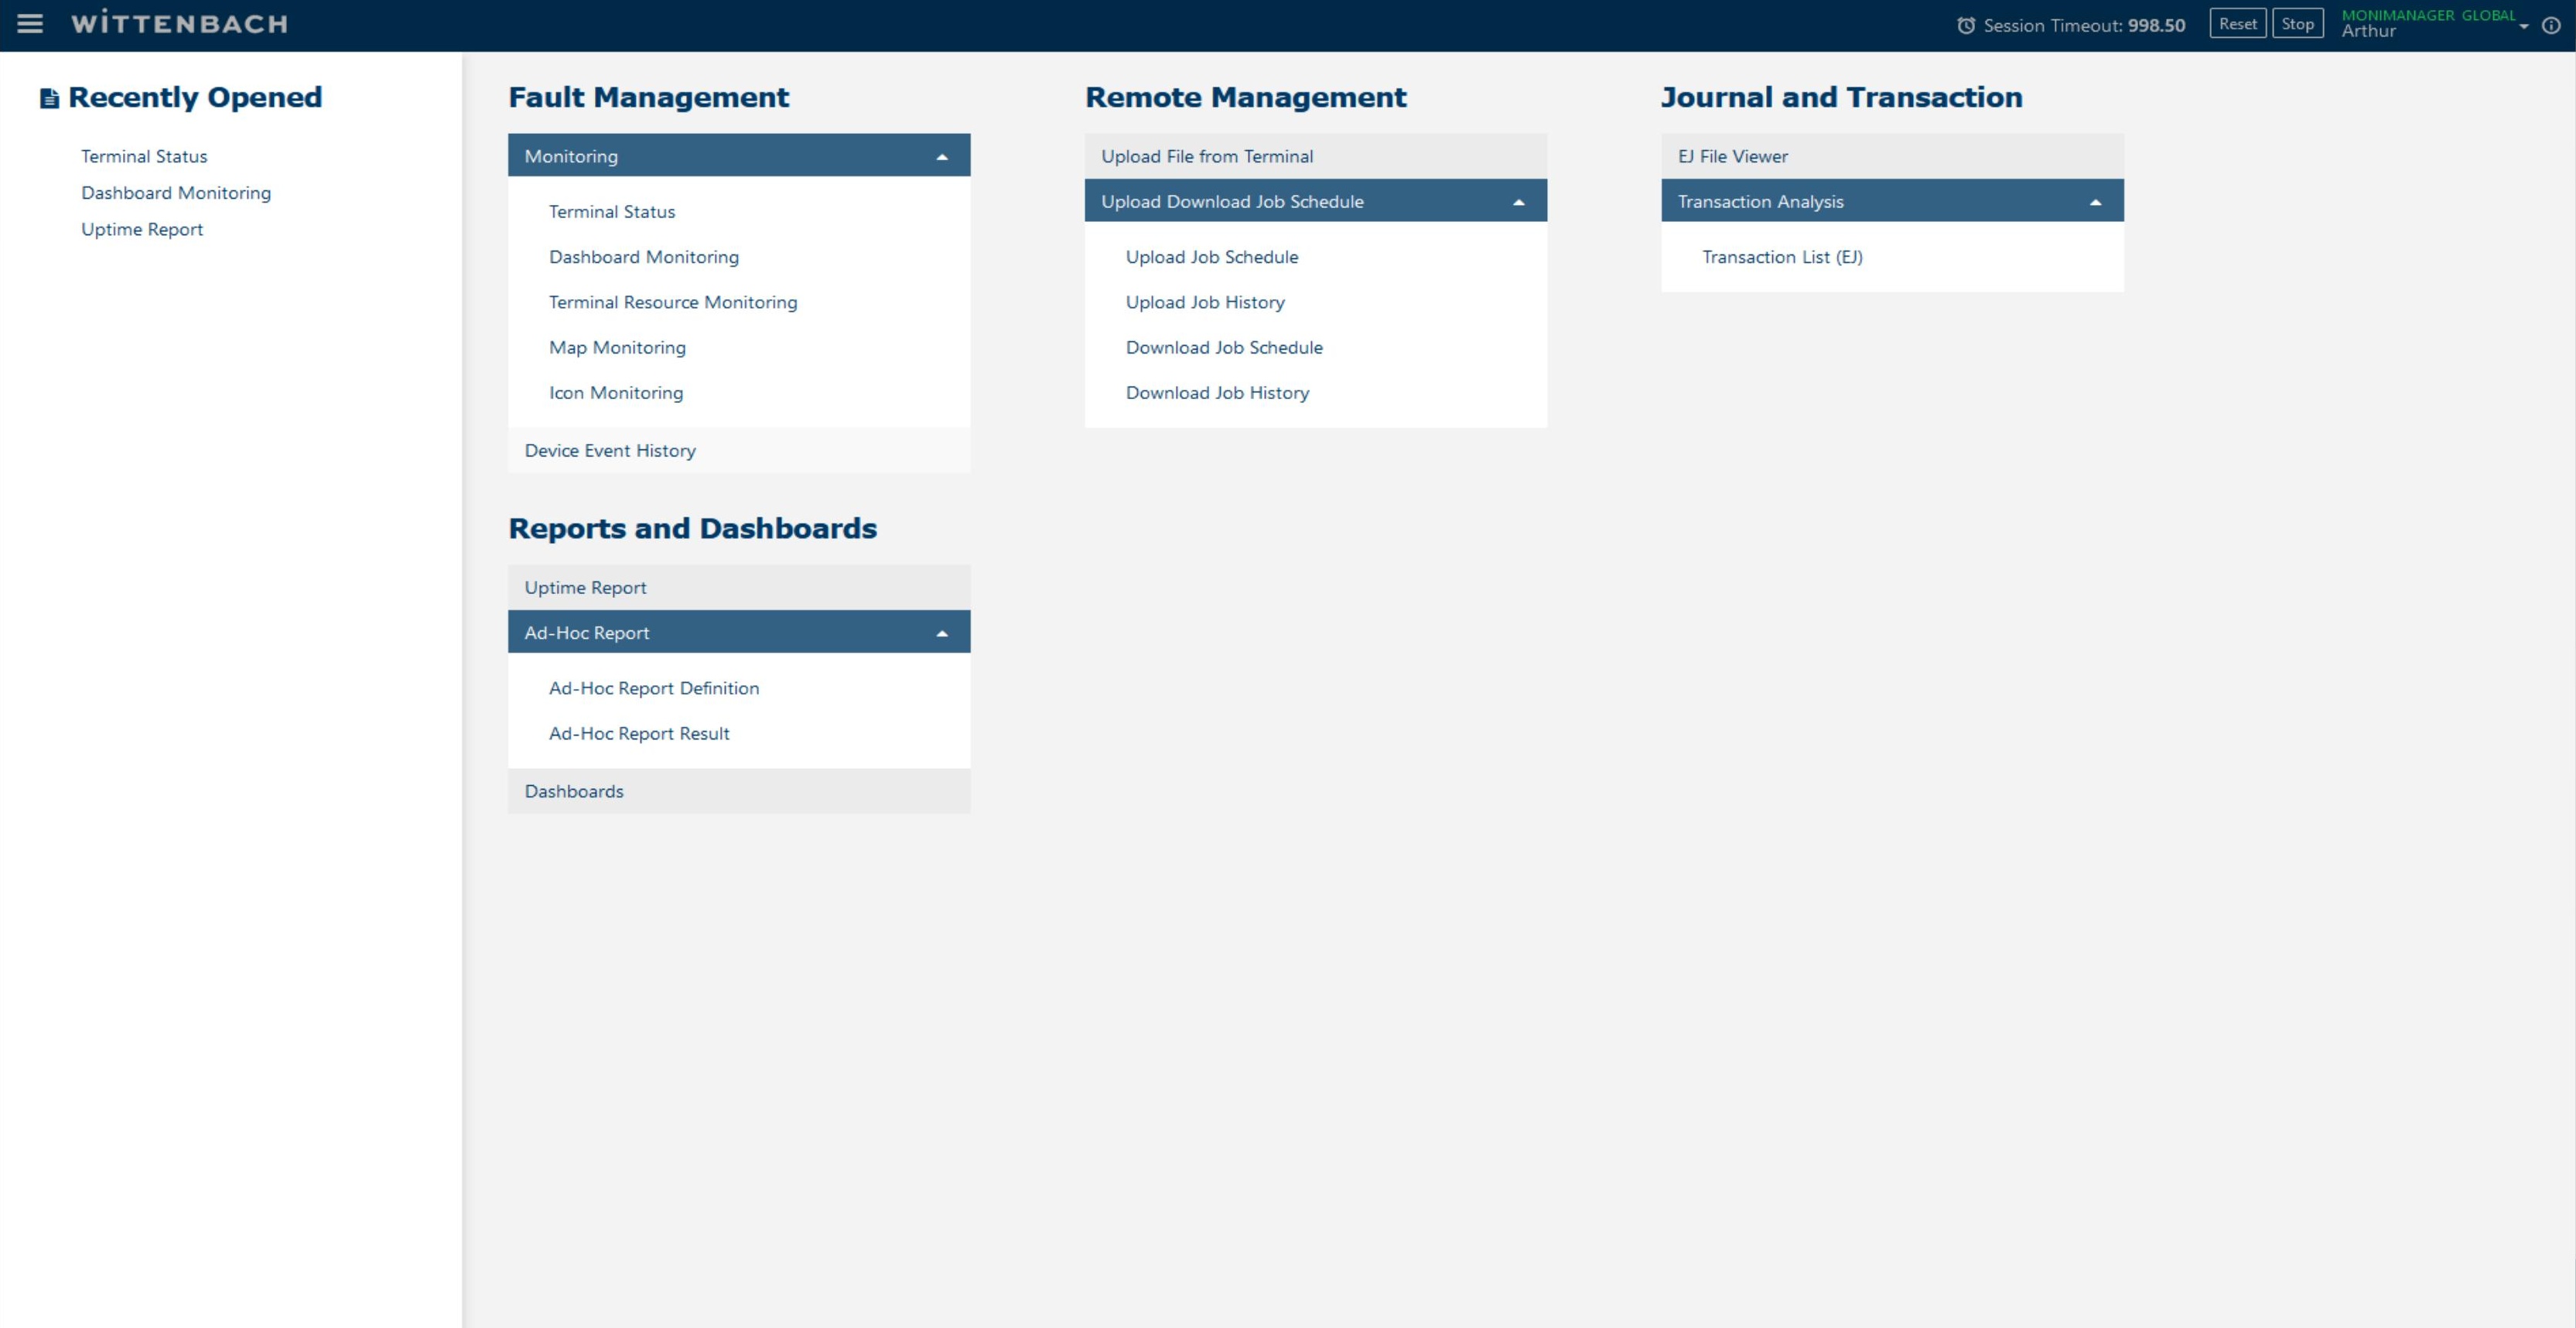
| Navigation Menu | Hidden by default — click the ☰ hamburger icon in the top-left to open. Organized by function category (Fault Management, Remote Management, Journal and Transaction, Reports and Dashboards, etc.) |
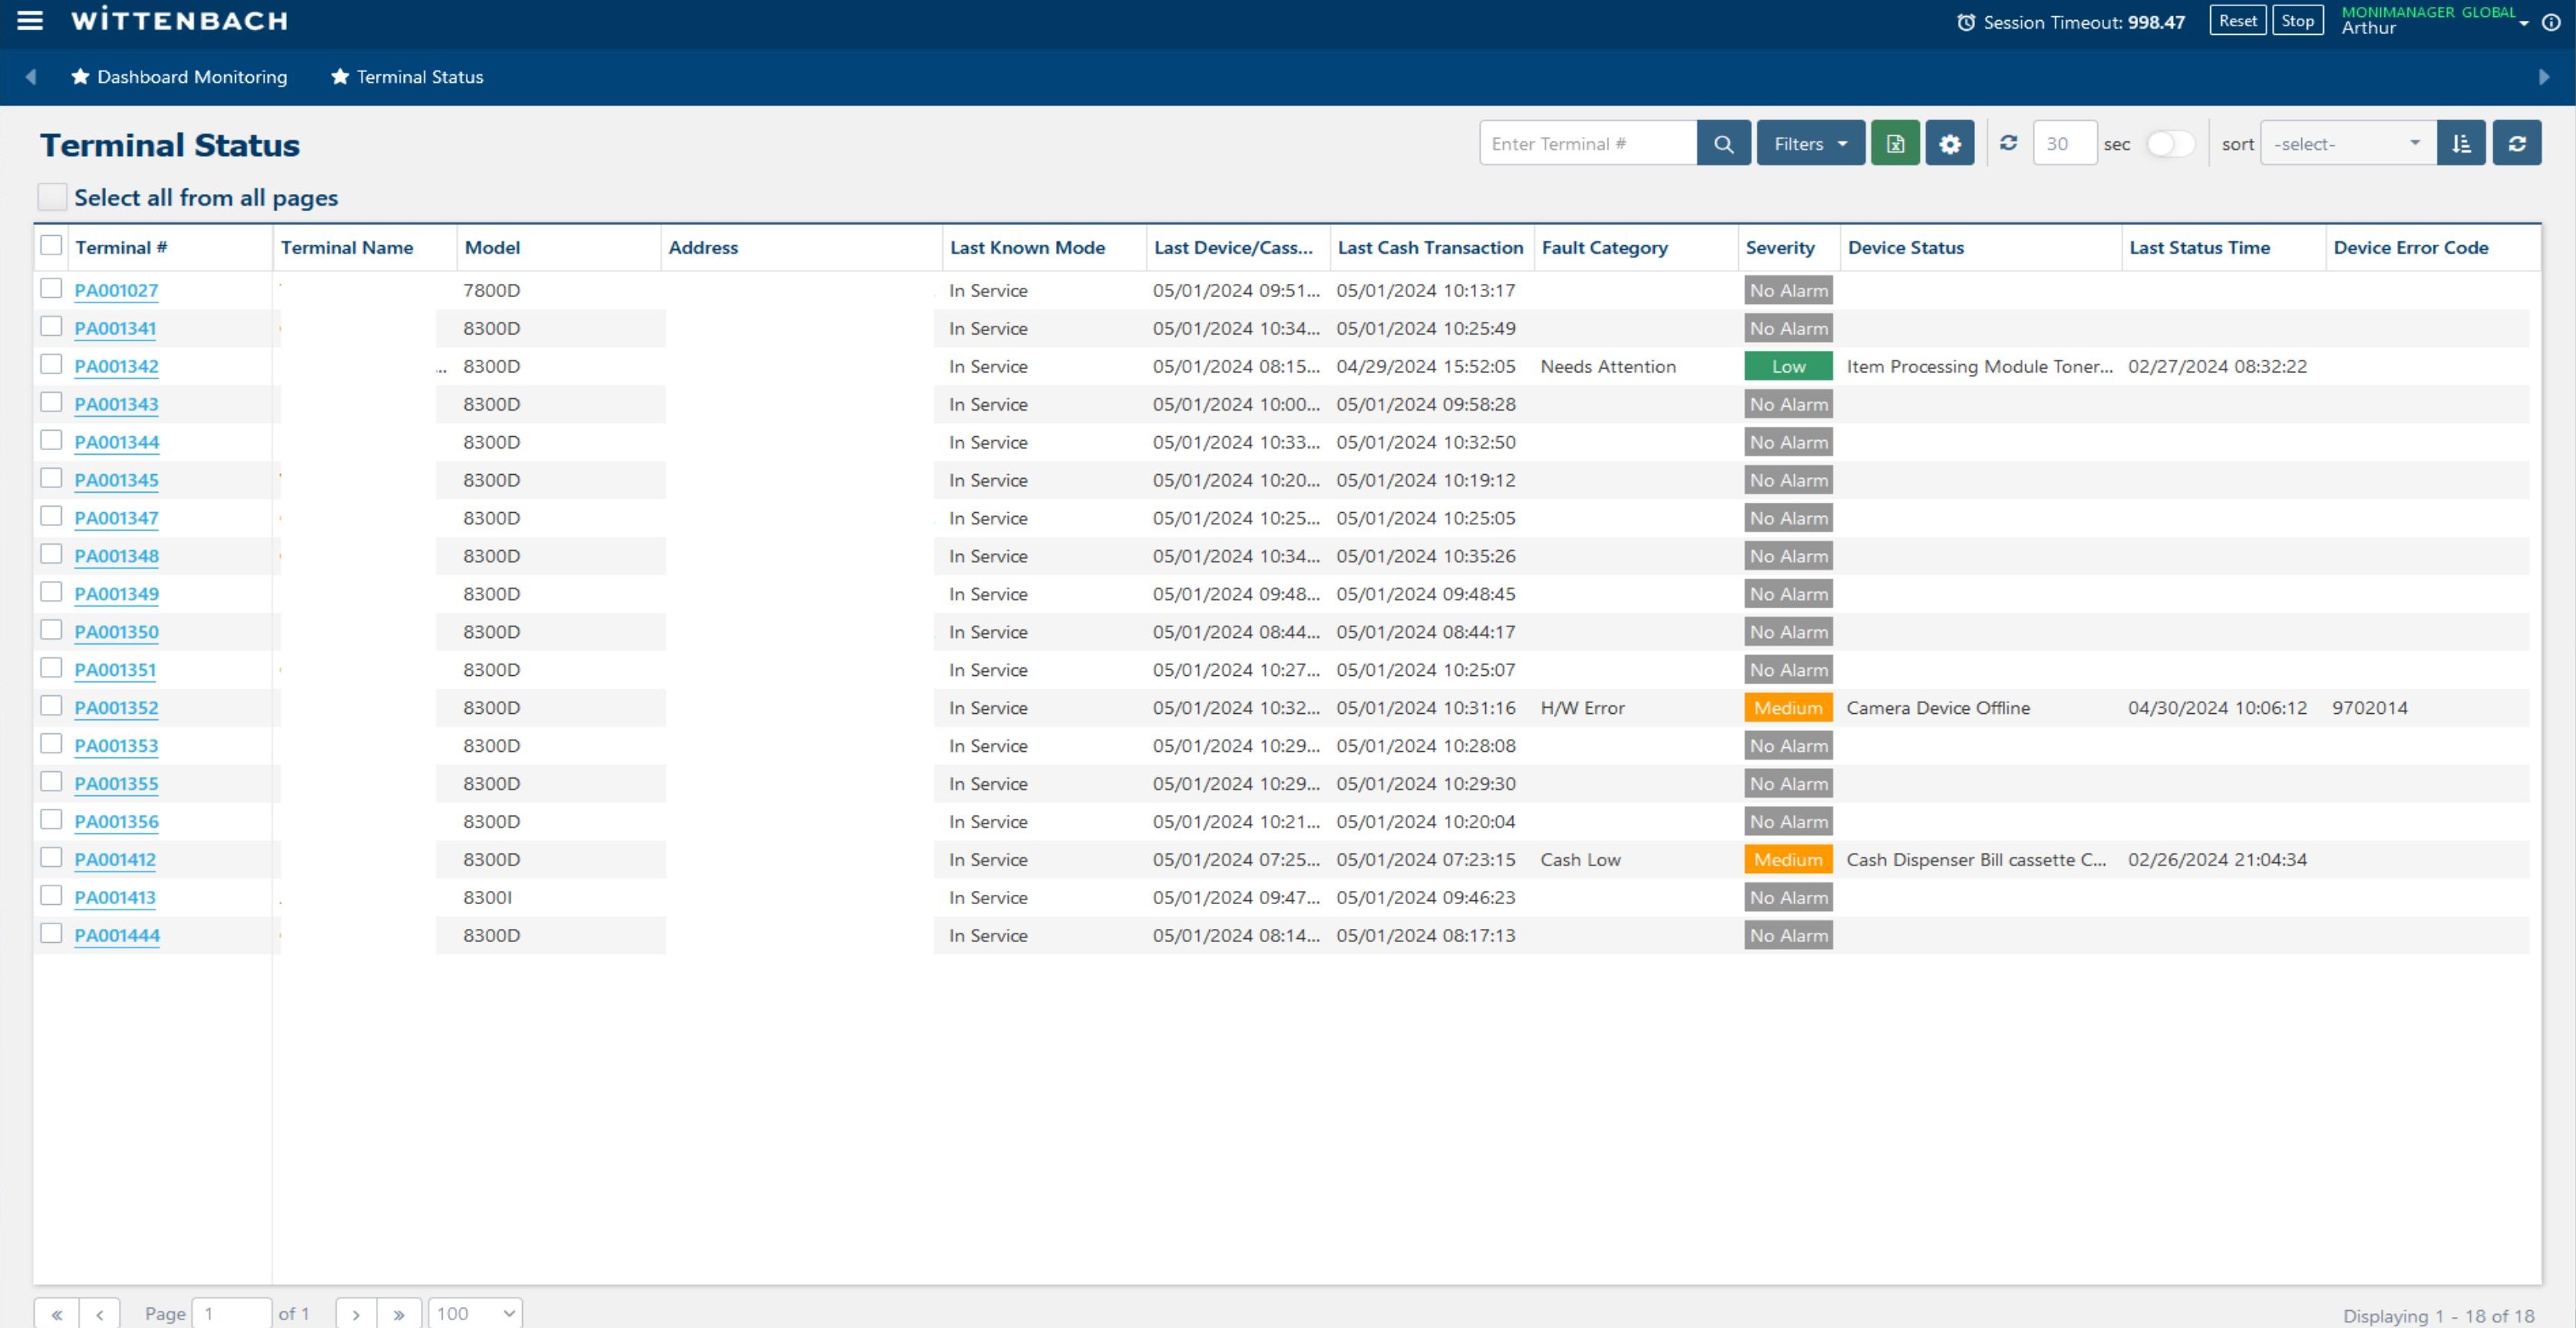
The Terminal Status page is your primary monitoring dashboard. Each row represents one ATM terminal in your fleet.
Key columns to watch:
| Column | What it shows |
|---|---|
| Terminal # | Clickable link (e.g. PA001027) — opens the terminal detail panel |
| Model | Hardware model (e.g. 7800D, 8300D) |
| Terminal Mode | Current operational state — see step 2 for all modes |
| Last Cash Transaction | Timestamp of the most recent cash withdrawal or deposit |
| Last Financial Tr Time | Timestamp of the last EJ-logged transaction (any type, including balance inquiry) |
| Fault Category | Active fault type — see step 3 for full definitions |
| Severity | No Alarm / Low / Medium / High — see step 4 for mapping |
| Device Status | Short description of the active hardware fault, if any |
| Device Error Code | Numeric/alphanumeric error code for fault diagnosis |
| AP Version | Terminal application version number |
The Terminal Mode column shows the terminal's last-known operational state reported by the ATM Agent:
| Mode | Meaning |
|---|---|
| In-Service | Terminal application running, sitting on the idle screen |
| Transaction | Customer has inserted a card or initiated a transaction |
| Out of Service | Terminal application running but displaying an out-of-service screen |
| Supervisor Mode | Terminal is in supervisor/maintenance mode |
| Offline | Terminal's communication with its transaction switch host is down |
| Power Up | Terminal application is starting up |
| Agent Down | The ATM Agent has lost communication with BlueVerse — the terminal may still be processing transactions |
The Fault Category column shows the terminal's current highest-priority fault. If the terminal is healthy, the column is blank. When multiple faults exist simultaneously, only the highest-priority one is displayed — use the Terminal Accordion to see all ongoing events.
| Fault Category | Meaning |
|---|---|
| Host Down | Terminal is offline with the switch/transaction host |
| Out of Service | Terminal is in OOS (Out-of-Service) mode |
| H/W Error | Hardware error detected on one or more devices; see Device Status and Device Error Code for specifics |
| Cash Out | Terminal is out of dispensable cash |
| Cash Low | Cash supply is running low in one or more cassettes |
| Cash High | Deposit storage/cassette is approaching capacity |
| Cash Full | Deposit storage/cassette is full |
| CDM-Reject Near Full | The cash handler's reject bin is nearing capacity |
| Cassette Fault | A cassette-related problem has been detected |
| Printer Problem | Receipt printer issue detected |
| Needs Attention | Terminal requires service attention (non-critical alert) |
| Supervisor Mode | Terminal is currently in supervisor/maintenance mode |
| Agent Down | The ATM Agent has lost connection to the BlueVerse server |
The Severity column derives its level from the active Fault Category. BlueVerse uses the following mapping:
| Severity | Fault Categories |
|---|---|
| High | Host Down, Out of Service, Cash Out, CDM-Reject Near Full, Cash Full / Cassette Full |
| Medium | H/W Error, Cash Low |
| Low | Supervisor Mode, Printer Problem, Needs Attention |
| No Alarm | All other states (normal operation) |
Use the toolbar controls at the top-right of the Terminal Status grid:
| Control | Function |
|---|---|
| Search box | Type a Terminal # (exact or partial) to filter the list |
| Filters button | Apply preset or custom filters (e.g. show only Out of Service, filter by device type) |
| Sort dropdown | Sort by any column — or click a column header directly; a red up-arrow indicates the active sort key |
| Refresh interval | Set the auto-refresh rate in seconds (default: 30); turn the toggle on/off to pause or resume |
| Manual Refresh icon | Force an immediate reload of terminal status |
Column Customization — The Terminal Status table columns are fully configurable per user. To customize:
- Show/hide columns: Click the column settings icon and check or uncheck each column
- Reorder columns: Drag and drop column headers to rearrange — place critical columns on the left so they're always visible
- Resize columns: Hold down the column divider and drag left or right to adjust width
- Click Save to persist your layout across sessions
Export to Excel — Select one or more terminals using the row checkboxes, then click the Excel icon in the toolbar. BlueVerse will download an Excel spreadsheet containing the selected terminals' status data.
Click any Terminal # link (blue, underlined) to open its detail panel. The panel slides in from the right side of the screen, overlaying the terminal list.
The General section is expanded by default and shows full terminal metadata:
| Field | Description |
|---|---|
| Terminal # | Unique ID (e.g. PA001027) |
| Address / Branch | Physical location and bank branch hierarchy |
| FLM / SLM | First/Second Level Maintenance assignments |
| Terminal Type | ATM or ITM |
| Model / Vendor | Hardware model and manufacturer (e.g. Hyosung) |
| Serial No | Physical serial number |
| Terminal IP | Network IP address of the ATM |
| Agent Version / AP Version | Monitoring agent and application versions installed |
| Operation Hours | Daily operating schedule (e.g. 00:00–23:59 all days) |
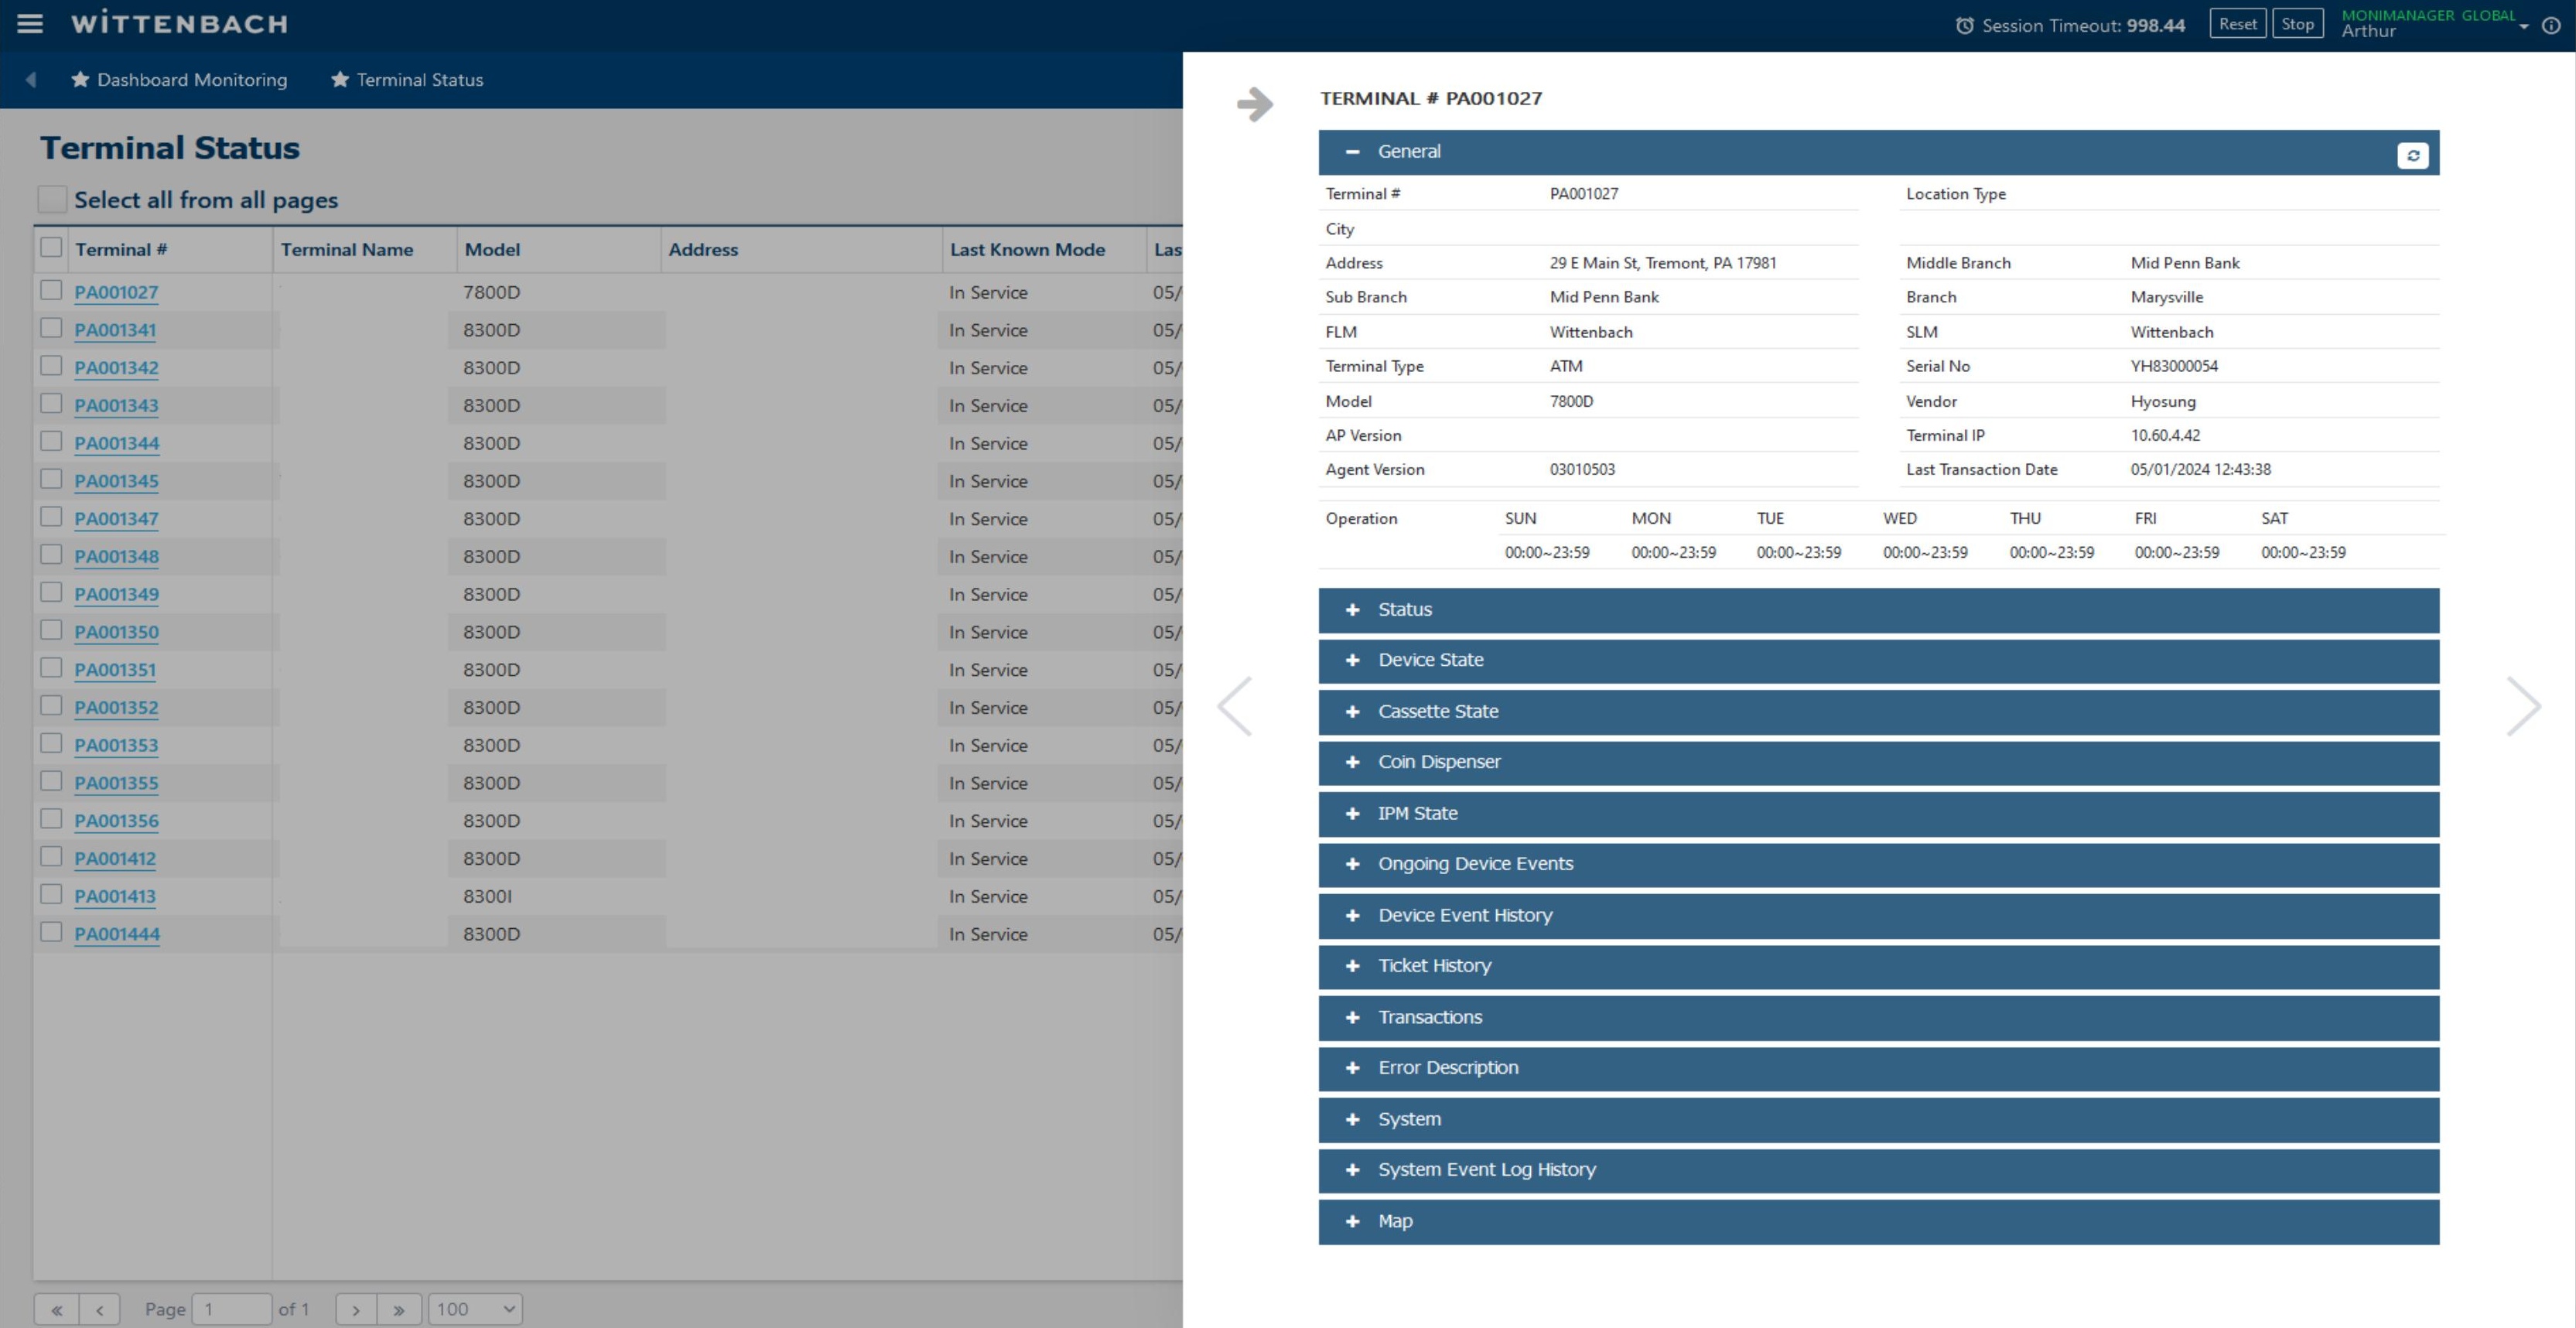
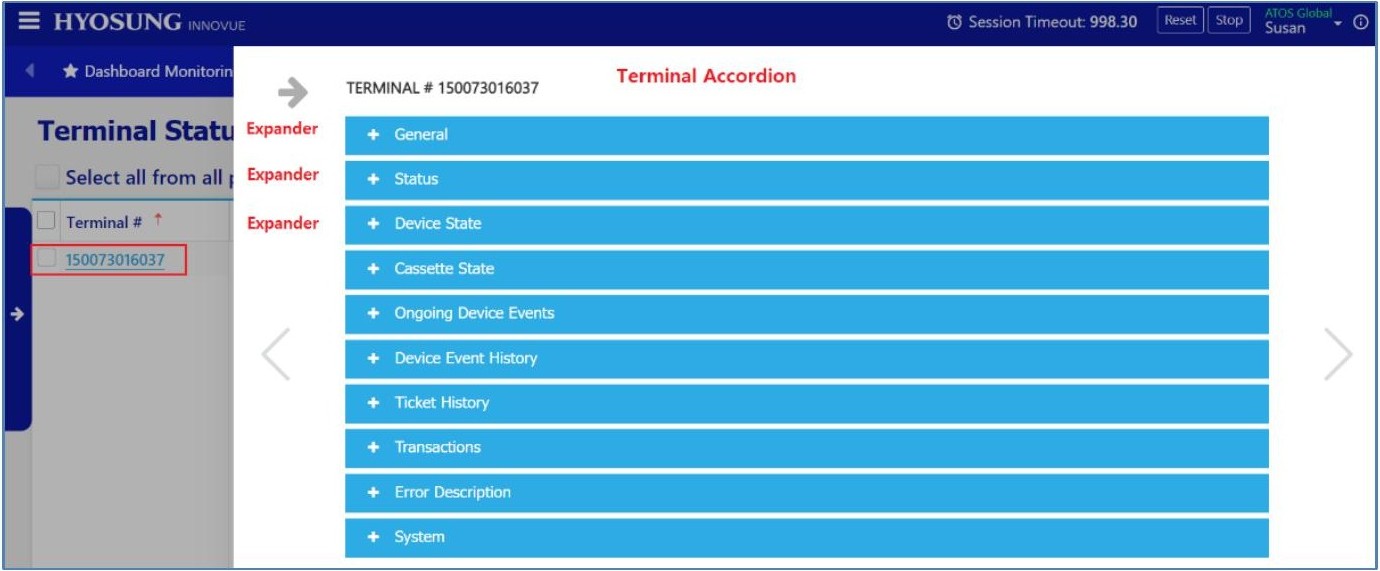
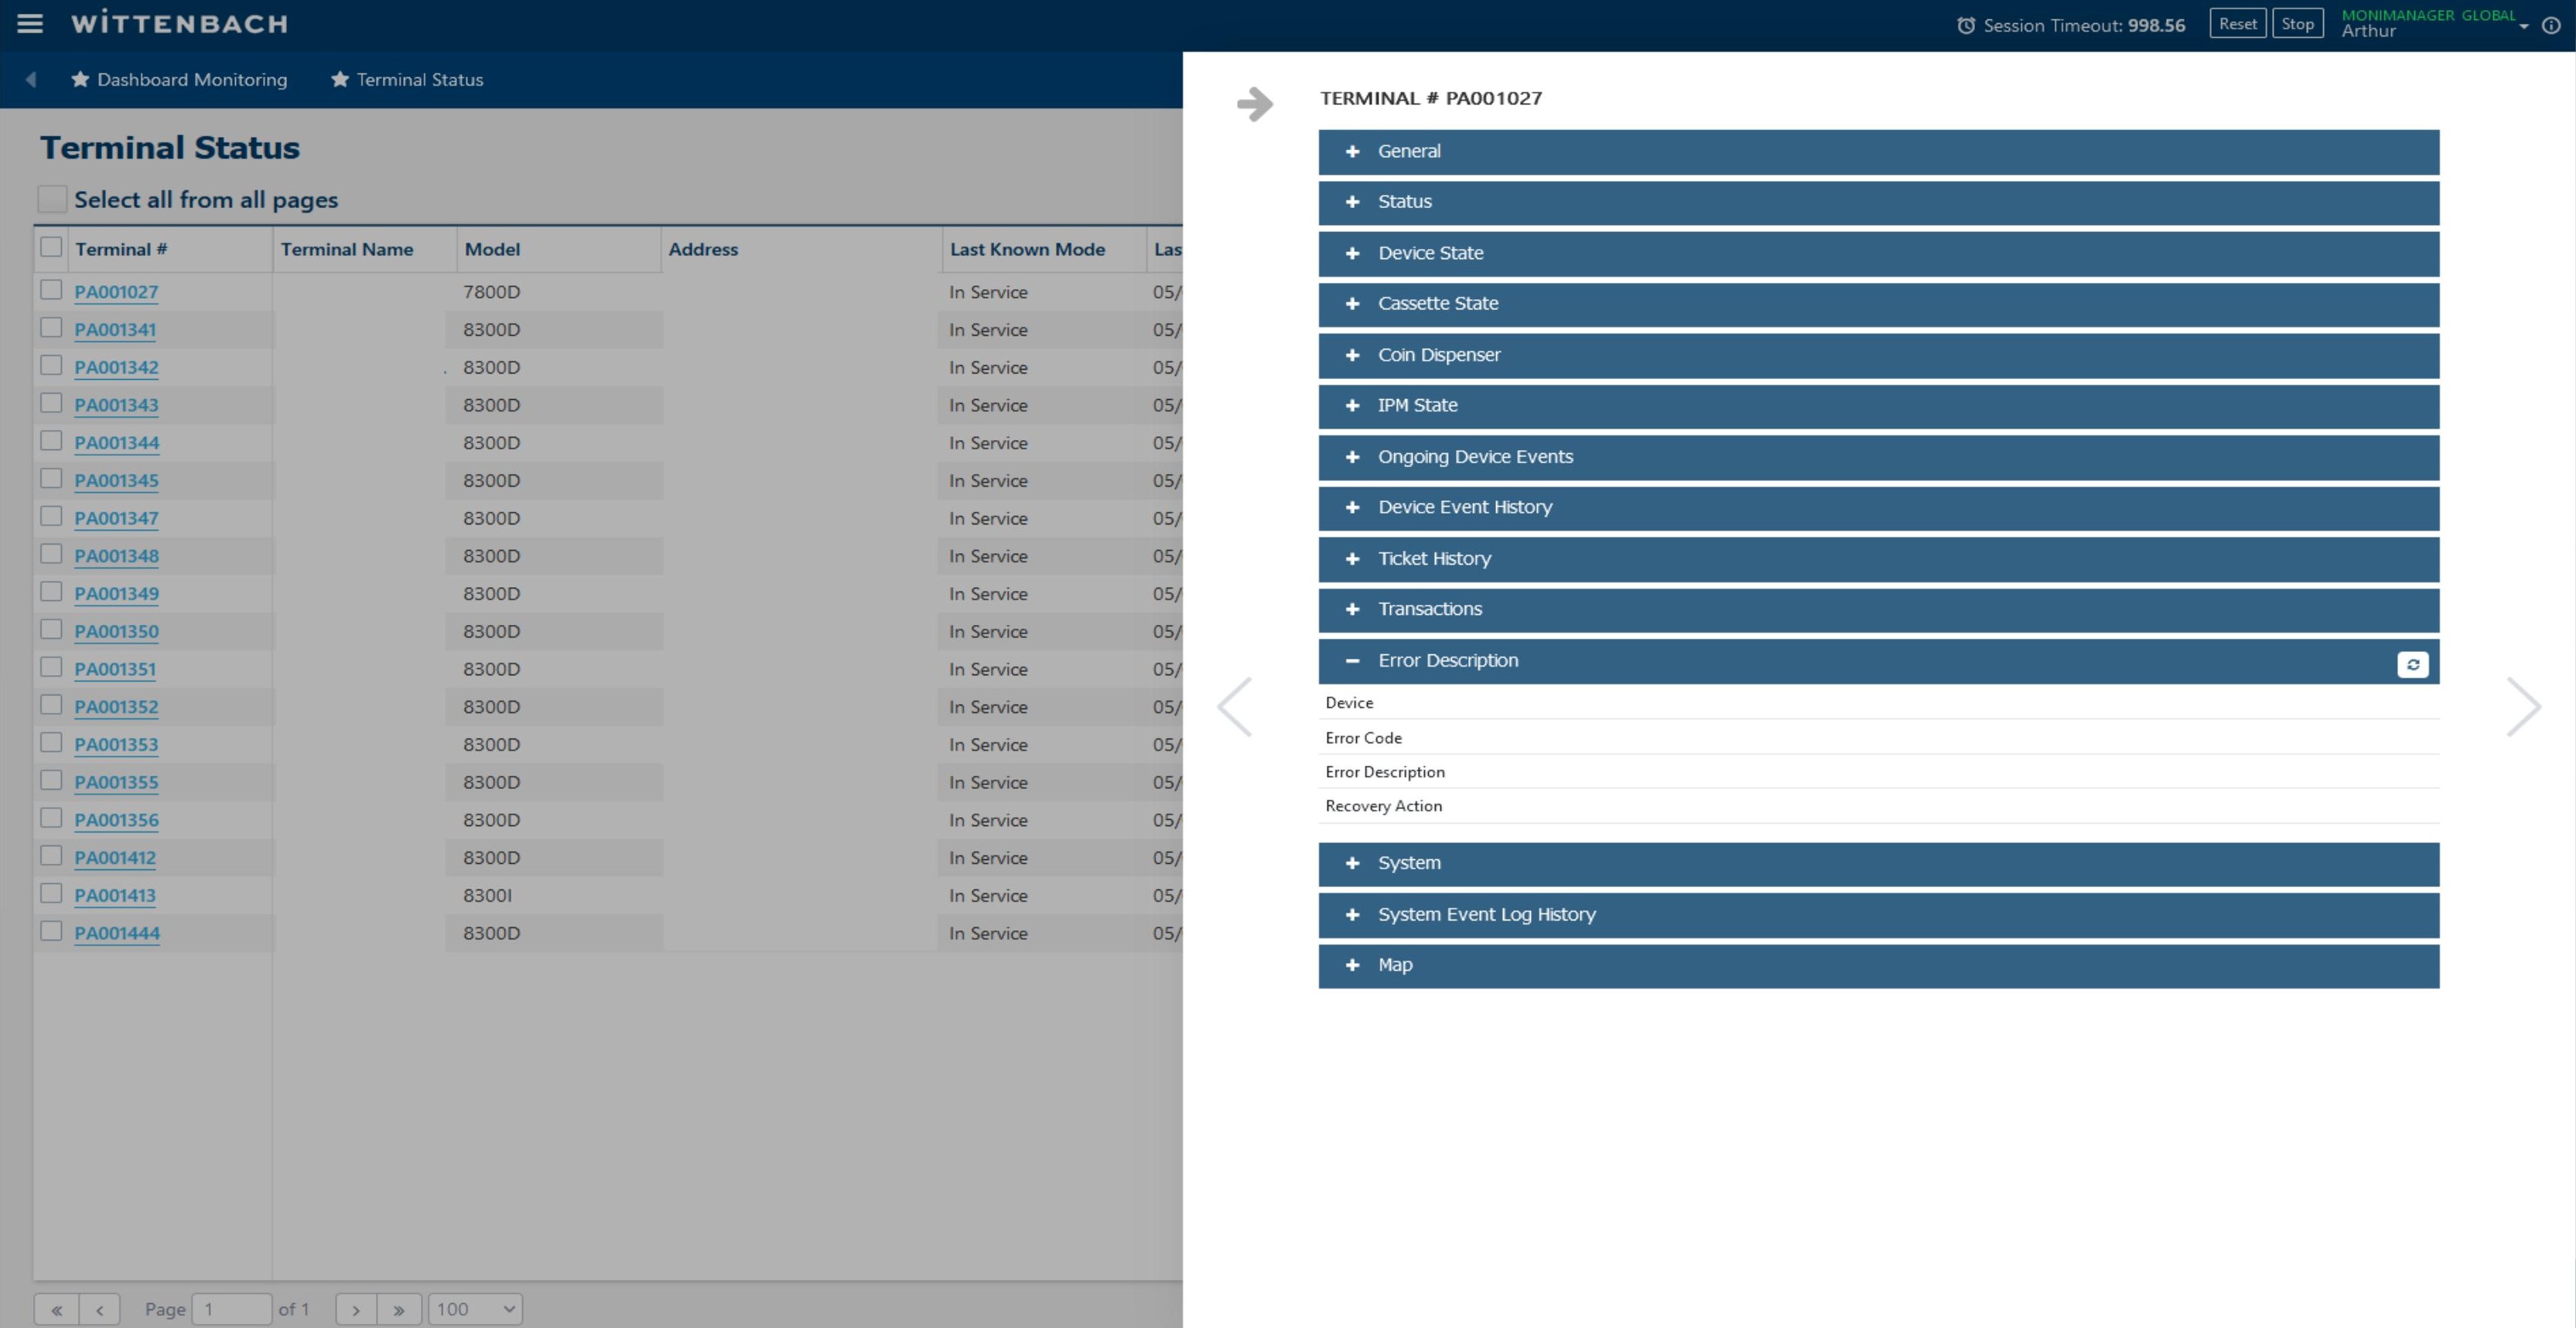
The detail panel contains multiple collapsible sections. Click the + button on any section header to expand it. Available sections:
- General — Location and configuration info
- Status — Current terminal status events
- Device State — Per-device component states
- Cassette State — Cash cassette fill levels
- Coin Dispenser — Coin module status (if equipped)
- IPM State — Item Processing Module (check/deposit) status
- Ongoing Device Events — Active faults in progress
- Device Event History — Historical fault log
- Ticket History — Service ticket log
- Transactions — Recent transaction records
- Error Description — Fault error codes and recovery actions
- System — System resources and ping tools
- System Event Log History — OS-level event log
- Map — Google Maps location of the terminal
Expand the Device State section to see the real-time status of each hardware component. Common devices listed:
| Device | Key States to Watch |
|---|---|
| Receipt Printer | Device Online/Offline, Paper Full/Empty, Ink, Toner |
| Card Reader | Device Online/Offline, Media Present/Not Present |
| Cash Dispenser | Shutter, Bill Cassette, Stacker, Reject, Transport, Dispenser state |
| Pinpad | Device Online/Offline |
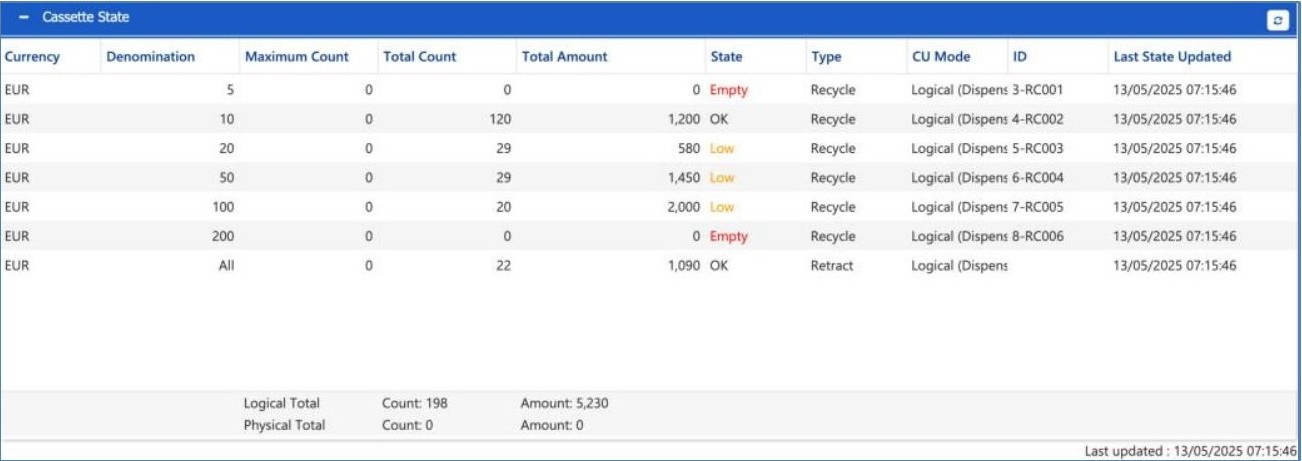
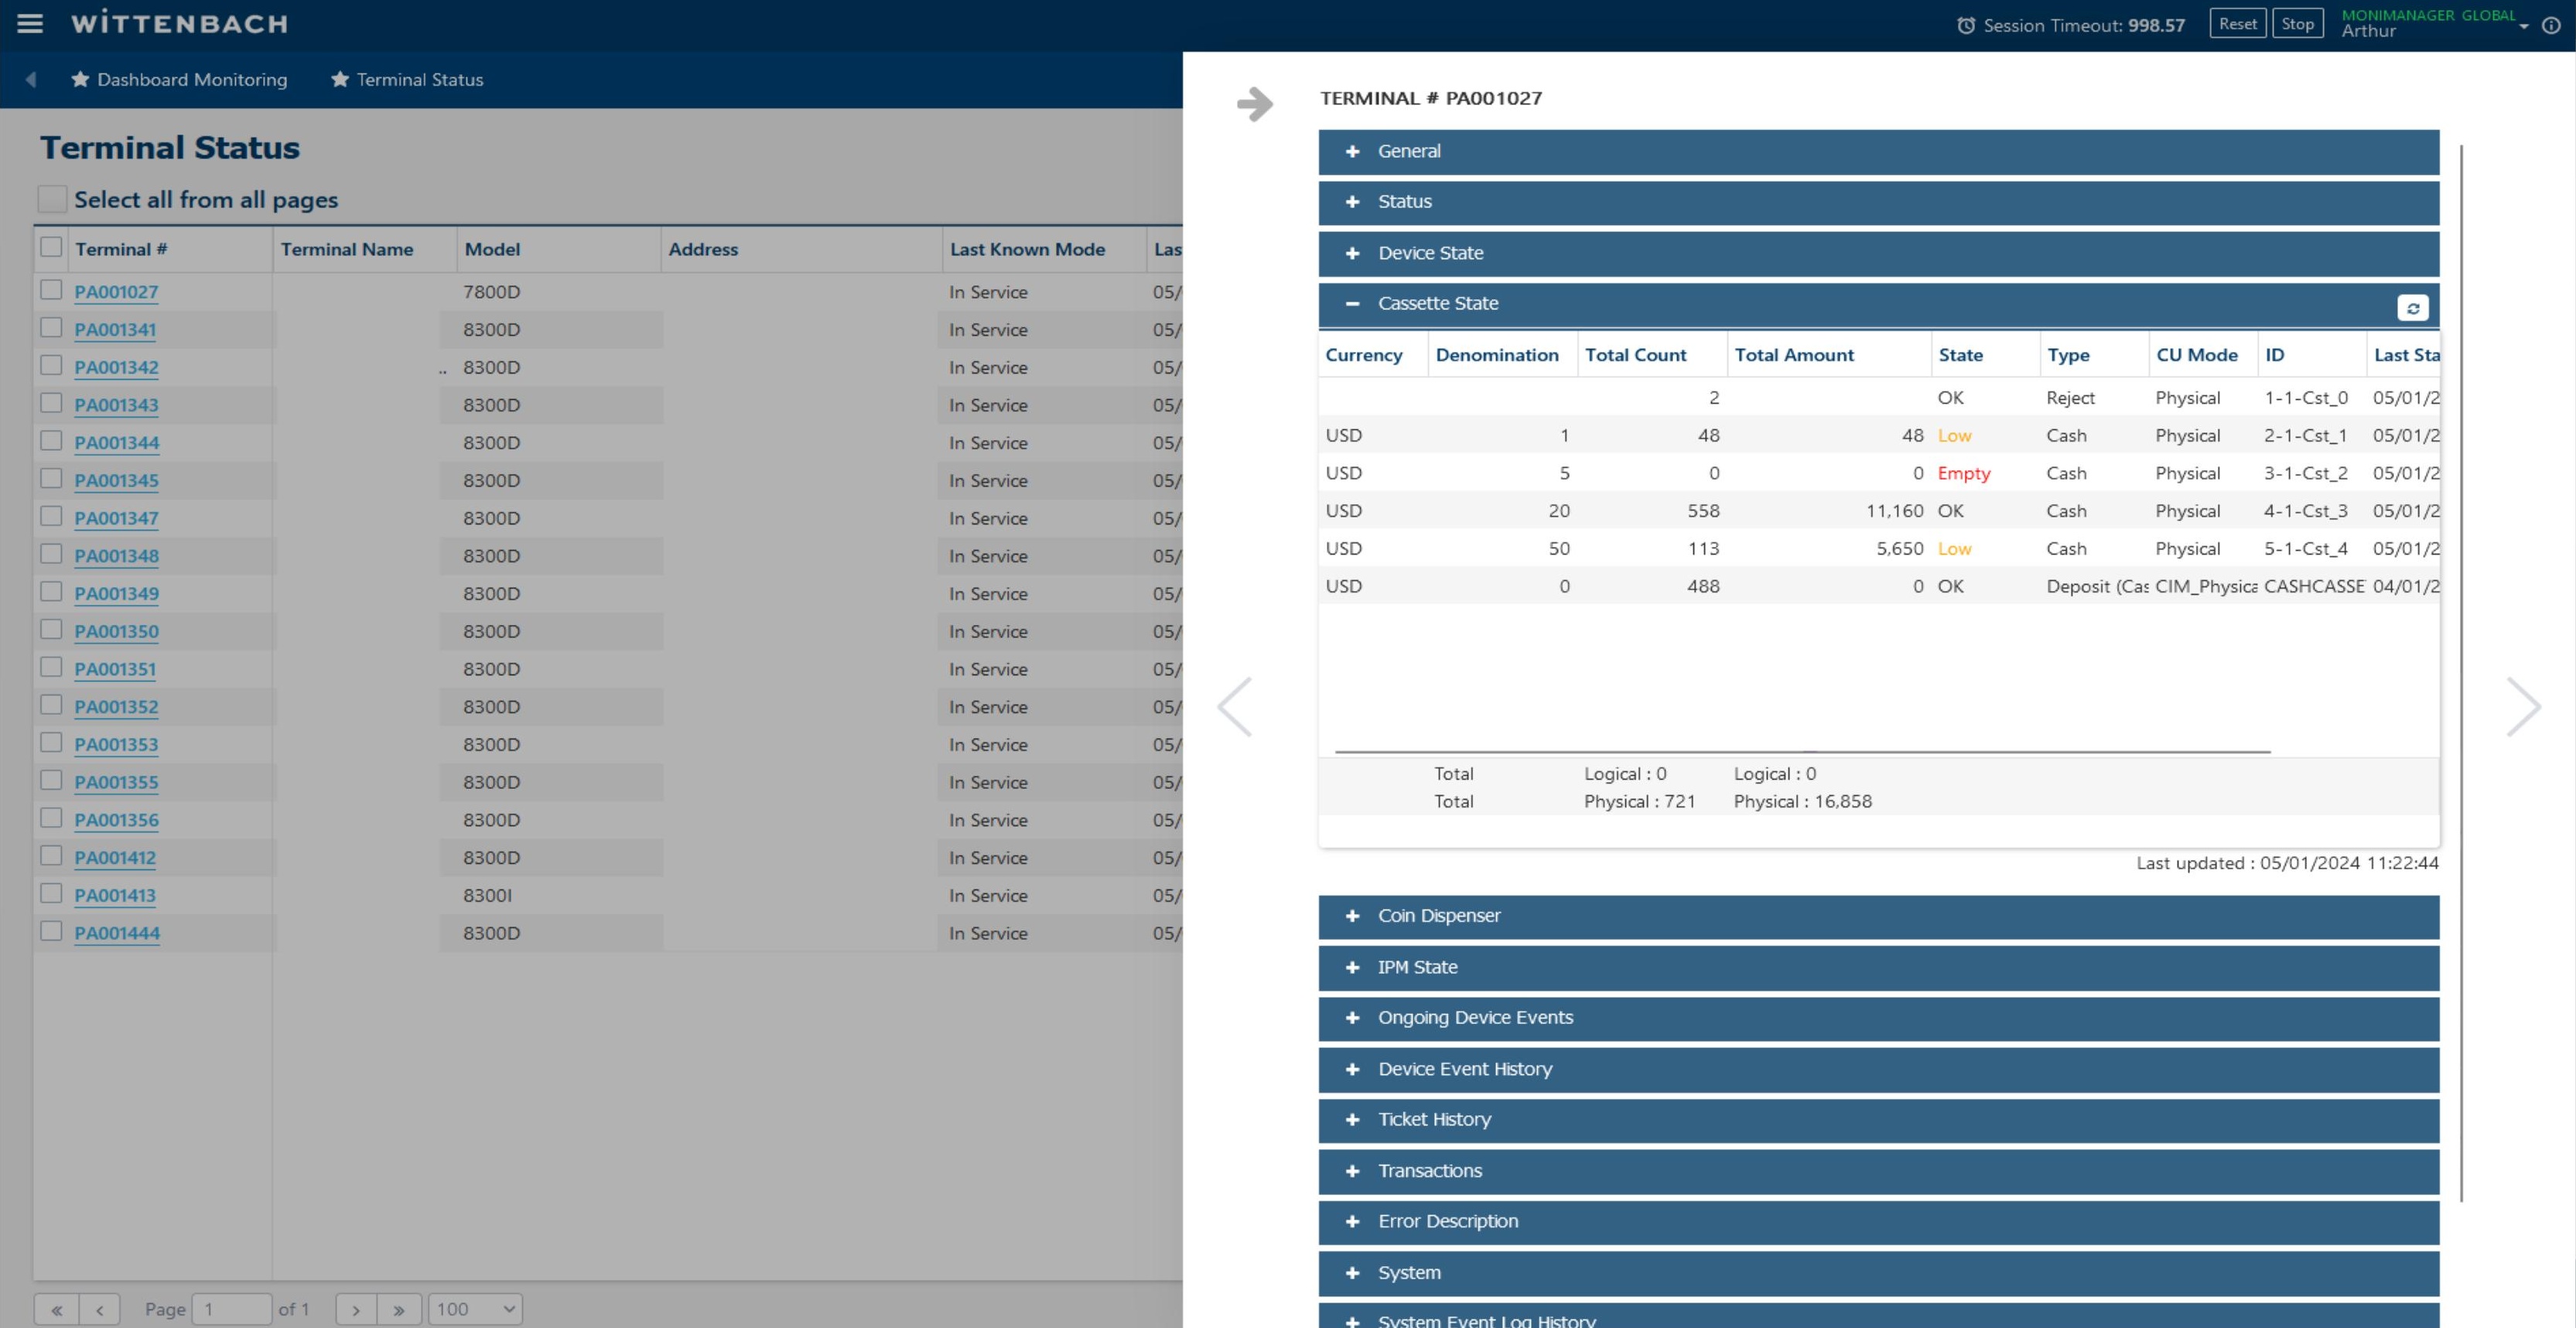
The Cassette State section shows all cash cassettes loaded in the ATM. For each cassette:
| Column | Meaning |
|---|---|
| Currency / Denomination | E.g. USD / $1, $5, $20, $50 |
| Maximum Count | Maximum number of notes the cassette can hold |
| Total Count | Current number of bills in the cassette |
| Total Amount | Cash value in dollars |
| State | OK / Low / High / Full / Empty — see color coding below |
| Type | Bill / Recycle / Reject / Retract / Deposit |
| CU Mode | Physical, Logical, or DenomDetails |
| ID | Cassette slot ID (e.g. 1-1-Cst_0) |
State color coding:
| State | Color | Meaning |
|---|---|---|
| OK | Normal | Cassette is operating normally |
| Low | Amber | Cash supply is running low — replenishment needed soon |
| Empty | Red | Cassette is empty — terminal cannot dispense from this cassette |
| High | Amber | Deposit/recycle cassette is filling up |
| Full | Red | Deposit/recycle/reject cassette is full — requires attention |
| Abnormal | Red | Hardware issue with the cassette (INOP, MISSING, or MANIP) |
The totals at the bottom show Physical and Logical counts. The "Last updated" timestamp shows when the data was last synced.
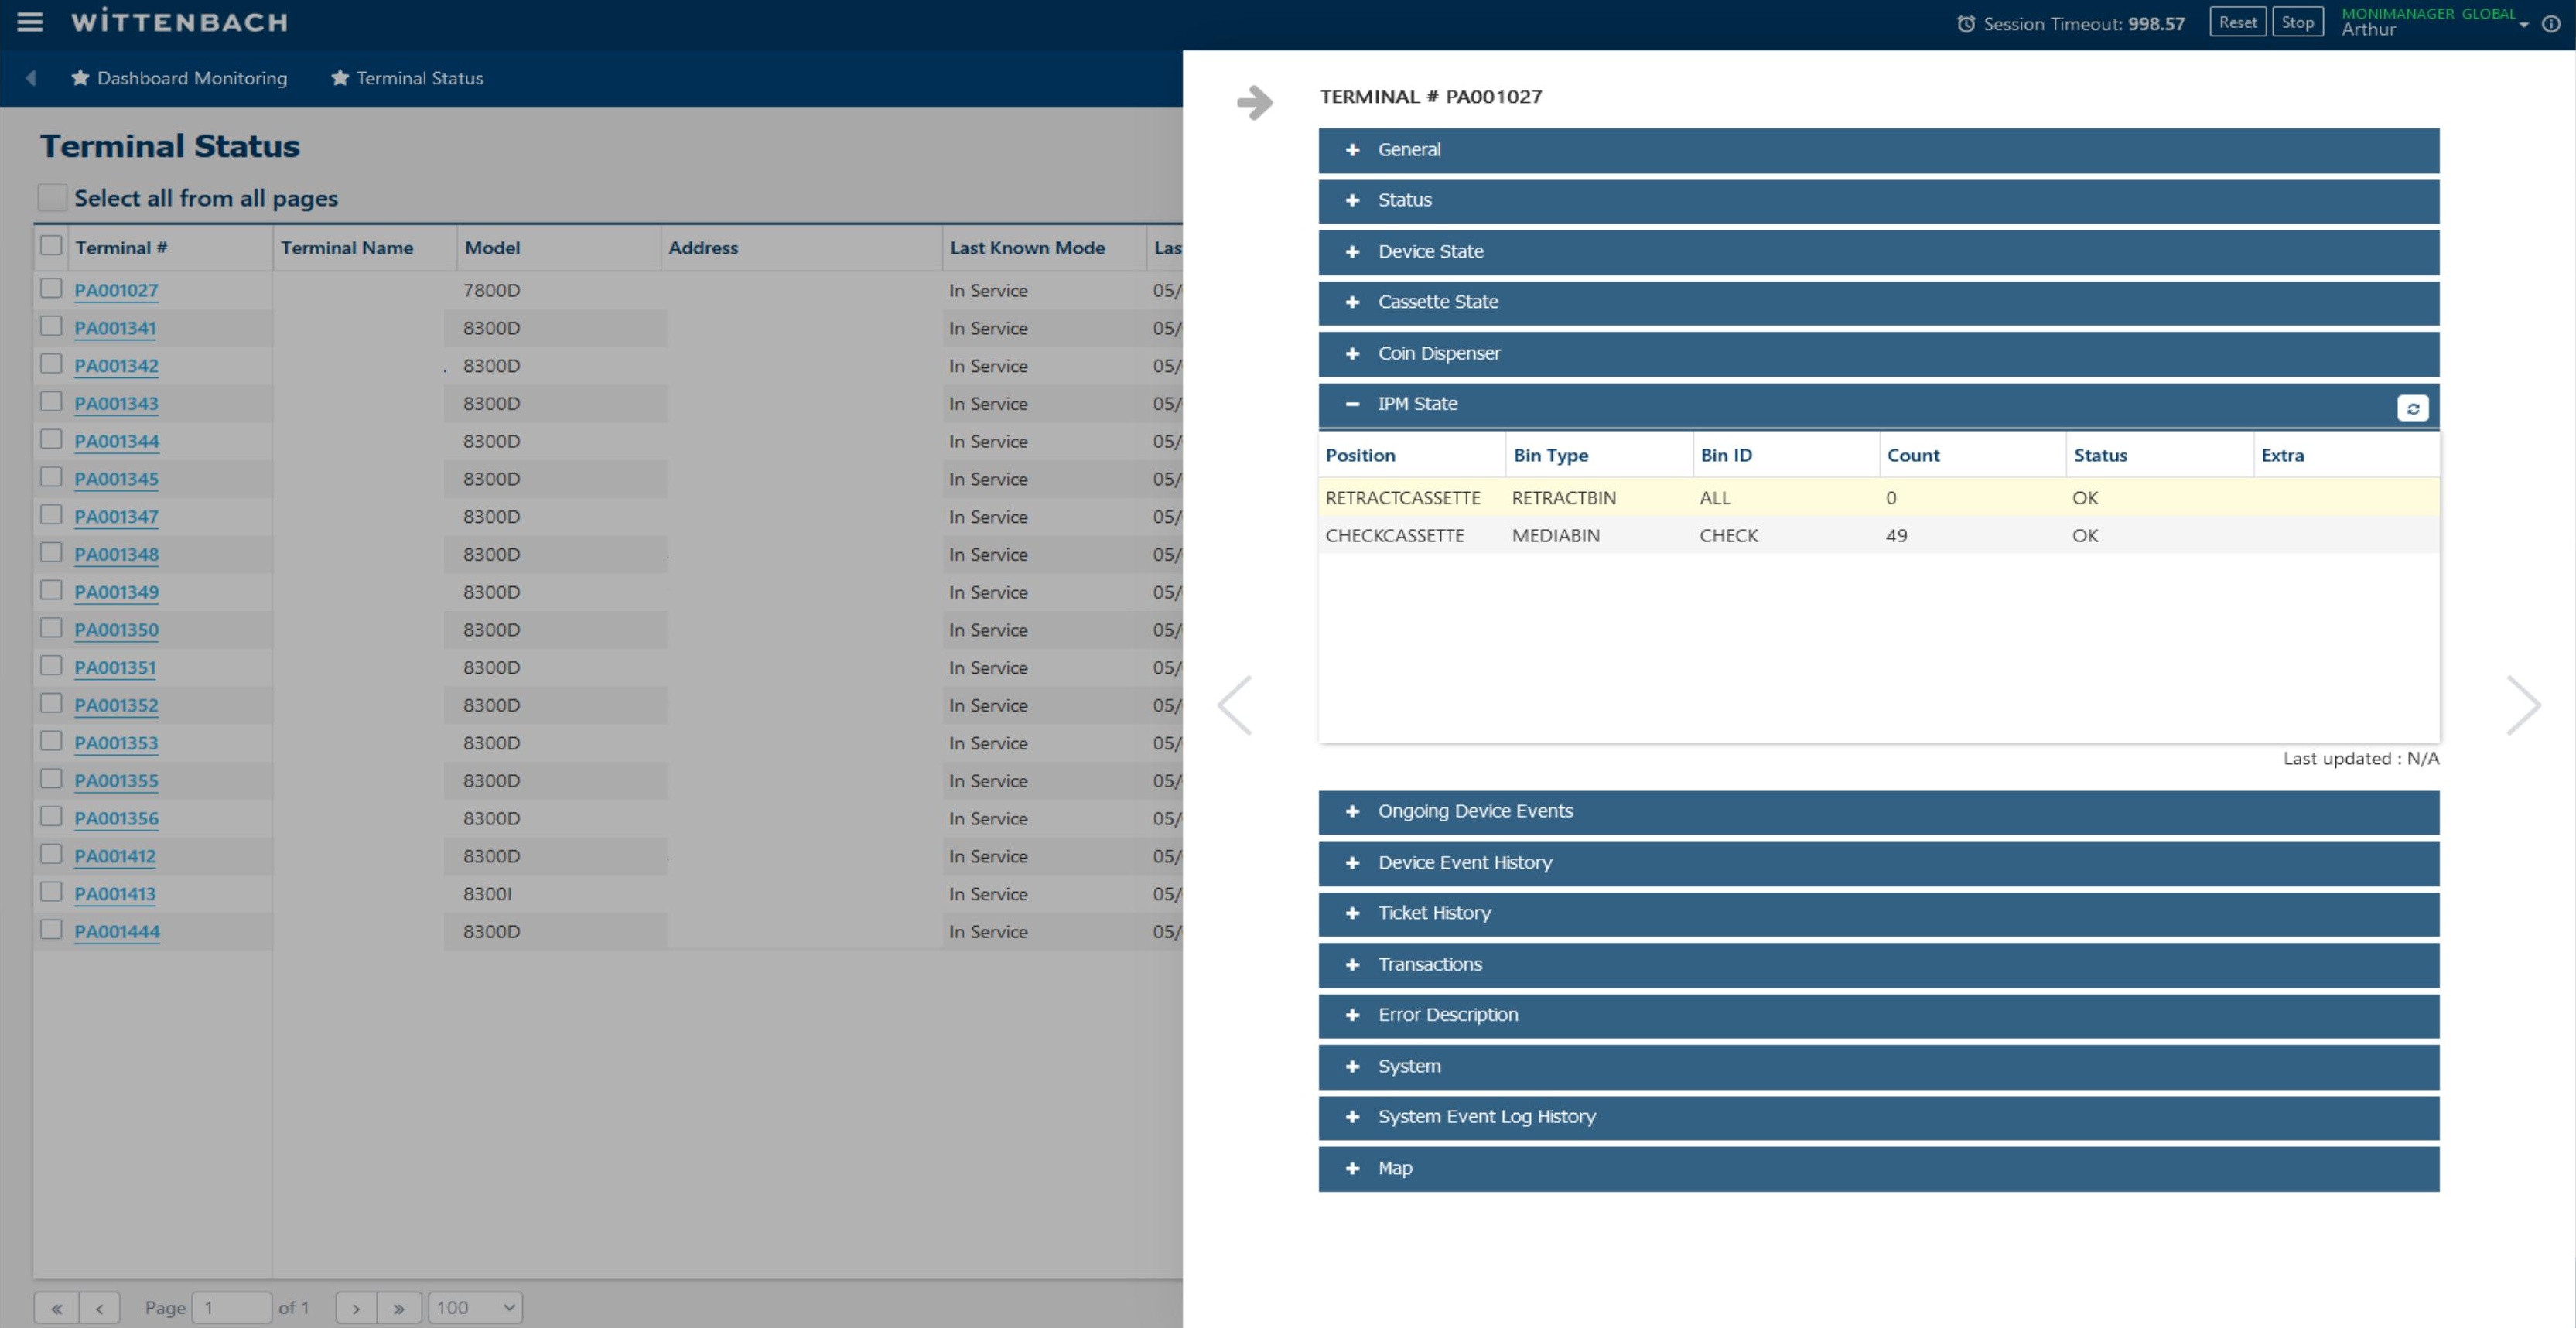
The IPM State section shows the status of the item/check processing module for ITMs or check-accepting ATMs. Key fields:
| Field | Description |
|---|---|
| Position | Bin slot (e.g. RETRACTCASSETTE, CHECKCASSETTE) |
| Bin Type | RETRACTBIN or MEDIABIN |
| Bin ID | ALL, CHECK, etc. |
| Count | Number of items in the bin |
| Status | OK / Error |
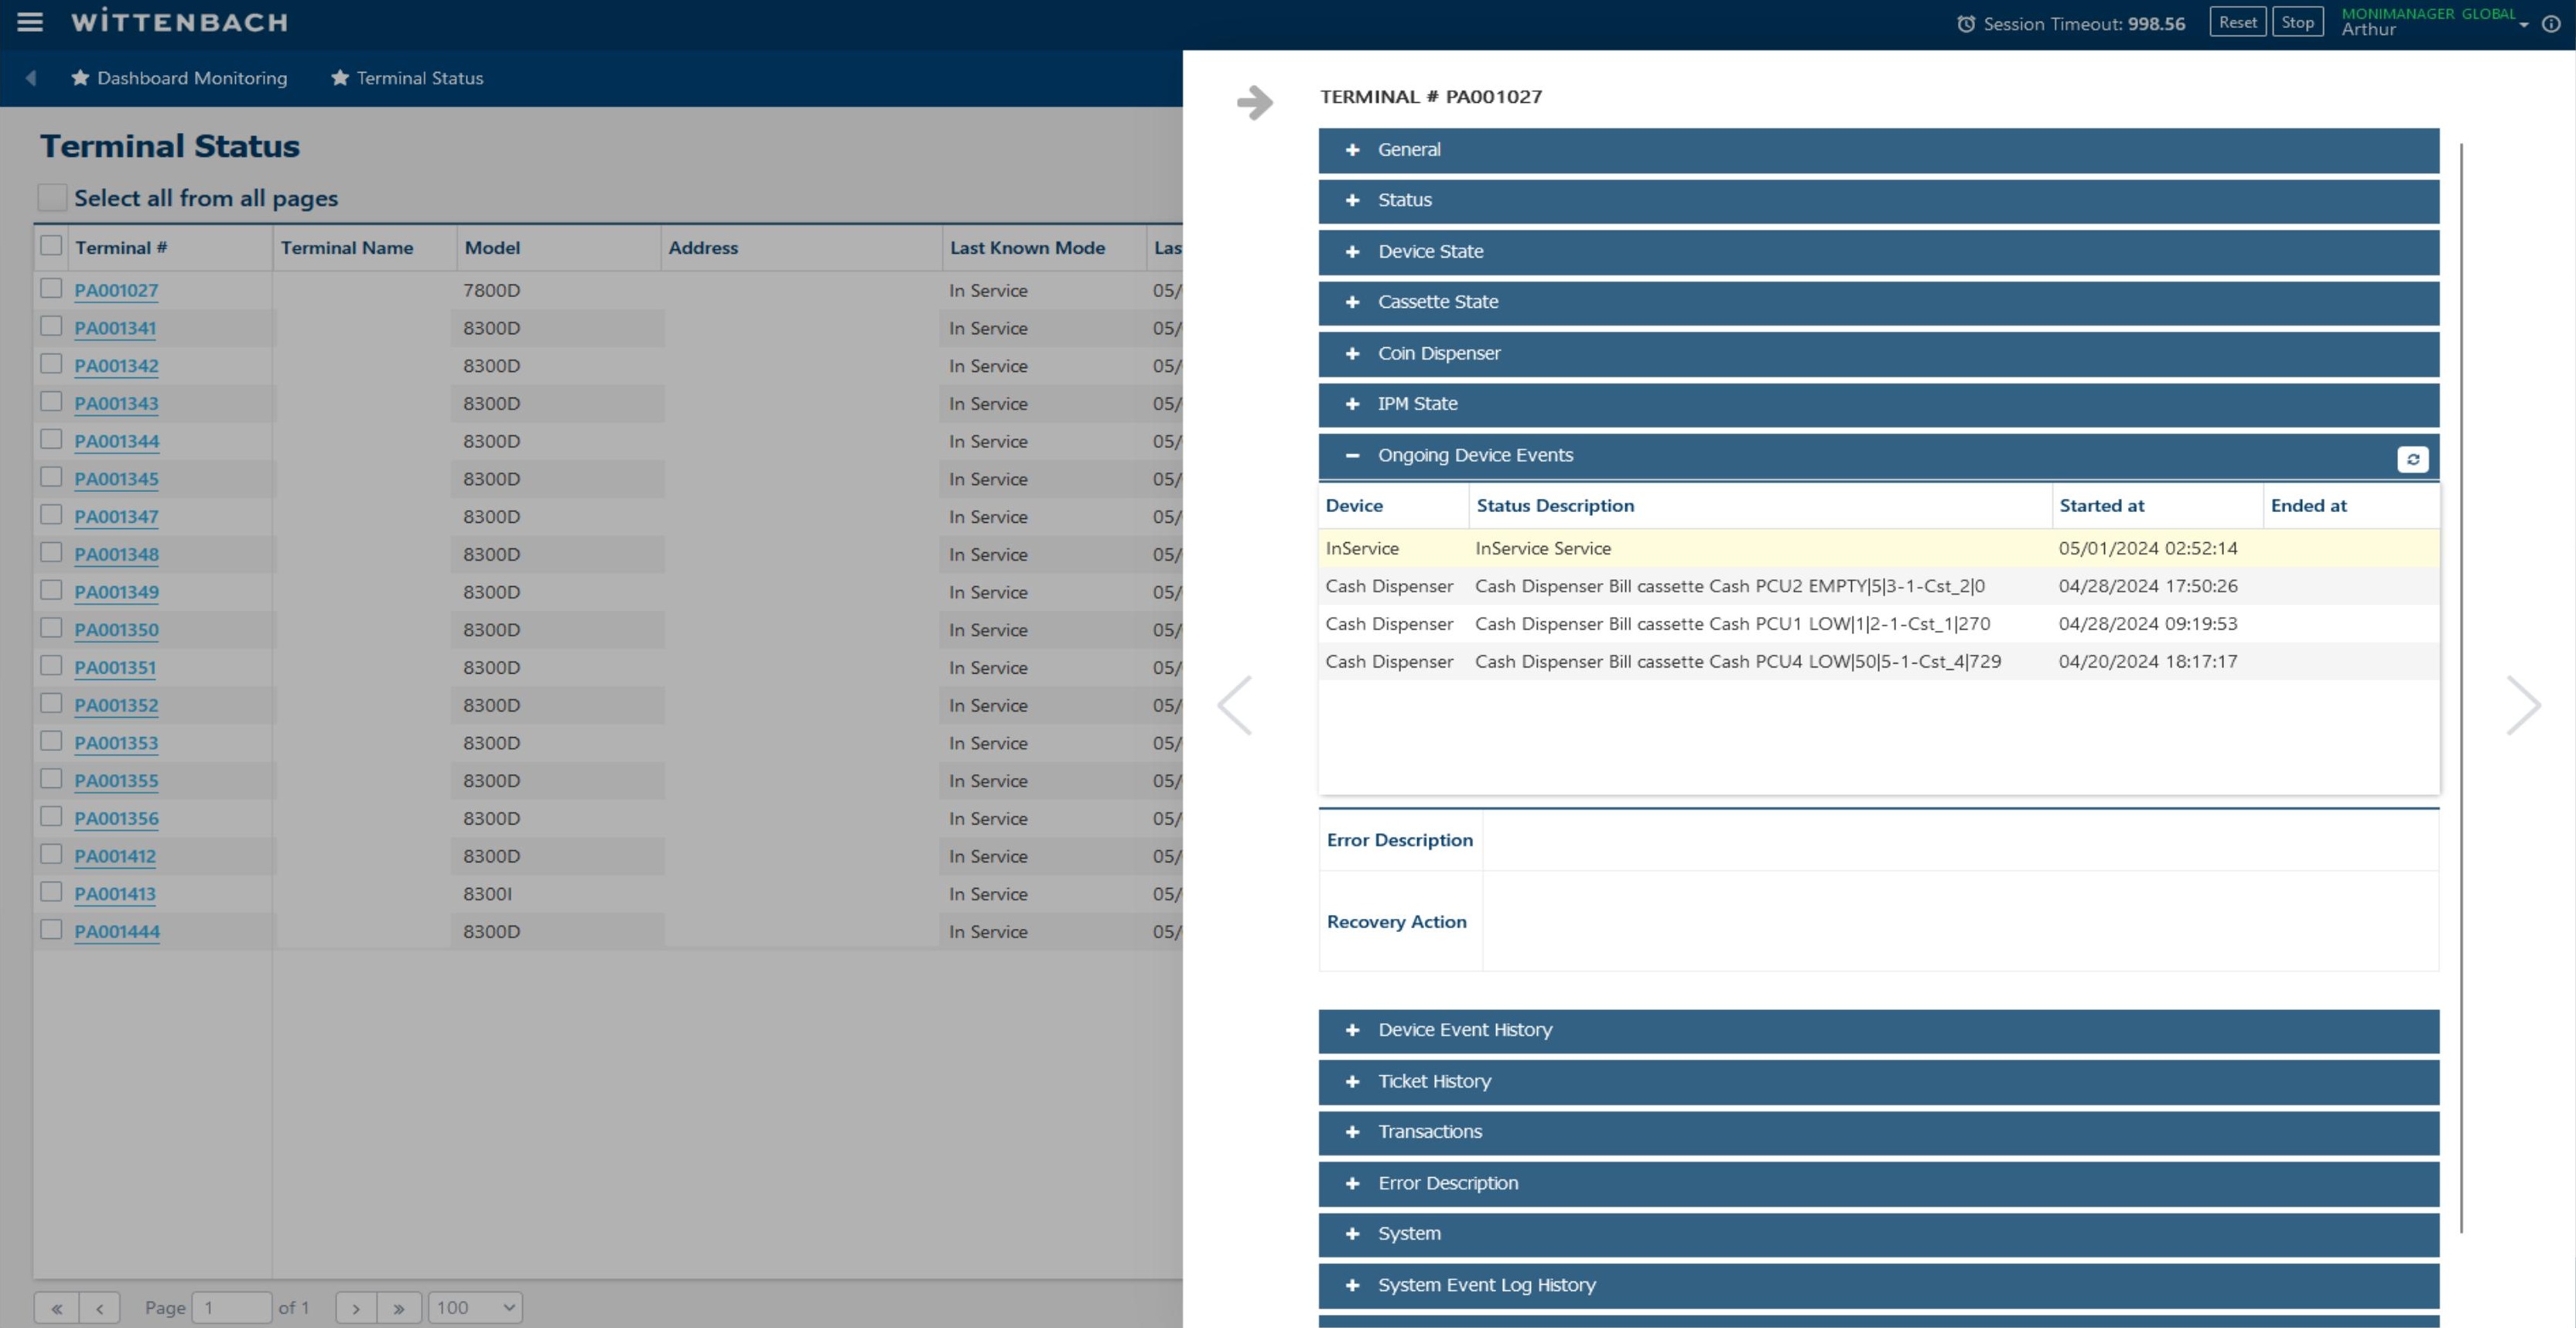
The Ongoing Device Events section lists all active faults that are currently in progress (no End Time yet). Events that have not yet resolved will appear here.
| Column | Meaning |
|---|---|
| Device | The component generating the event (InService, Cash Dispenser, etc.) |
| Status Description | Full description of the fault or state |
| Started at | When the event began |
| Ended at | Blank = still ongoing |
The Error Description and Recovery Action fields below the event table provide guidance on how to address the fault.
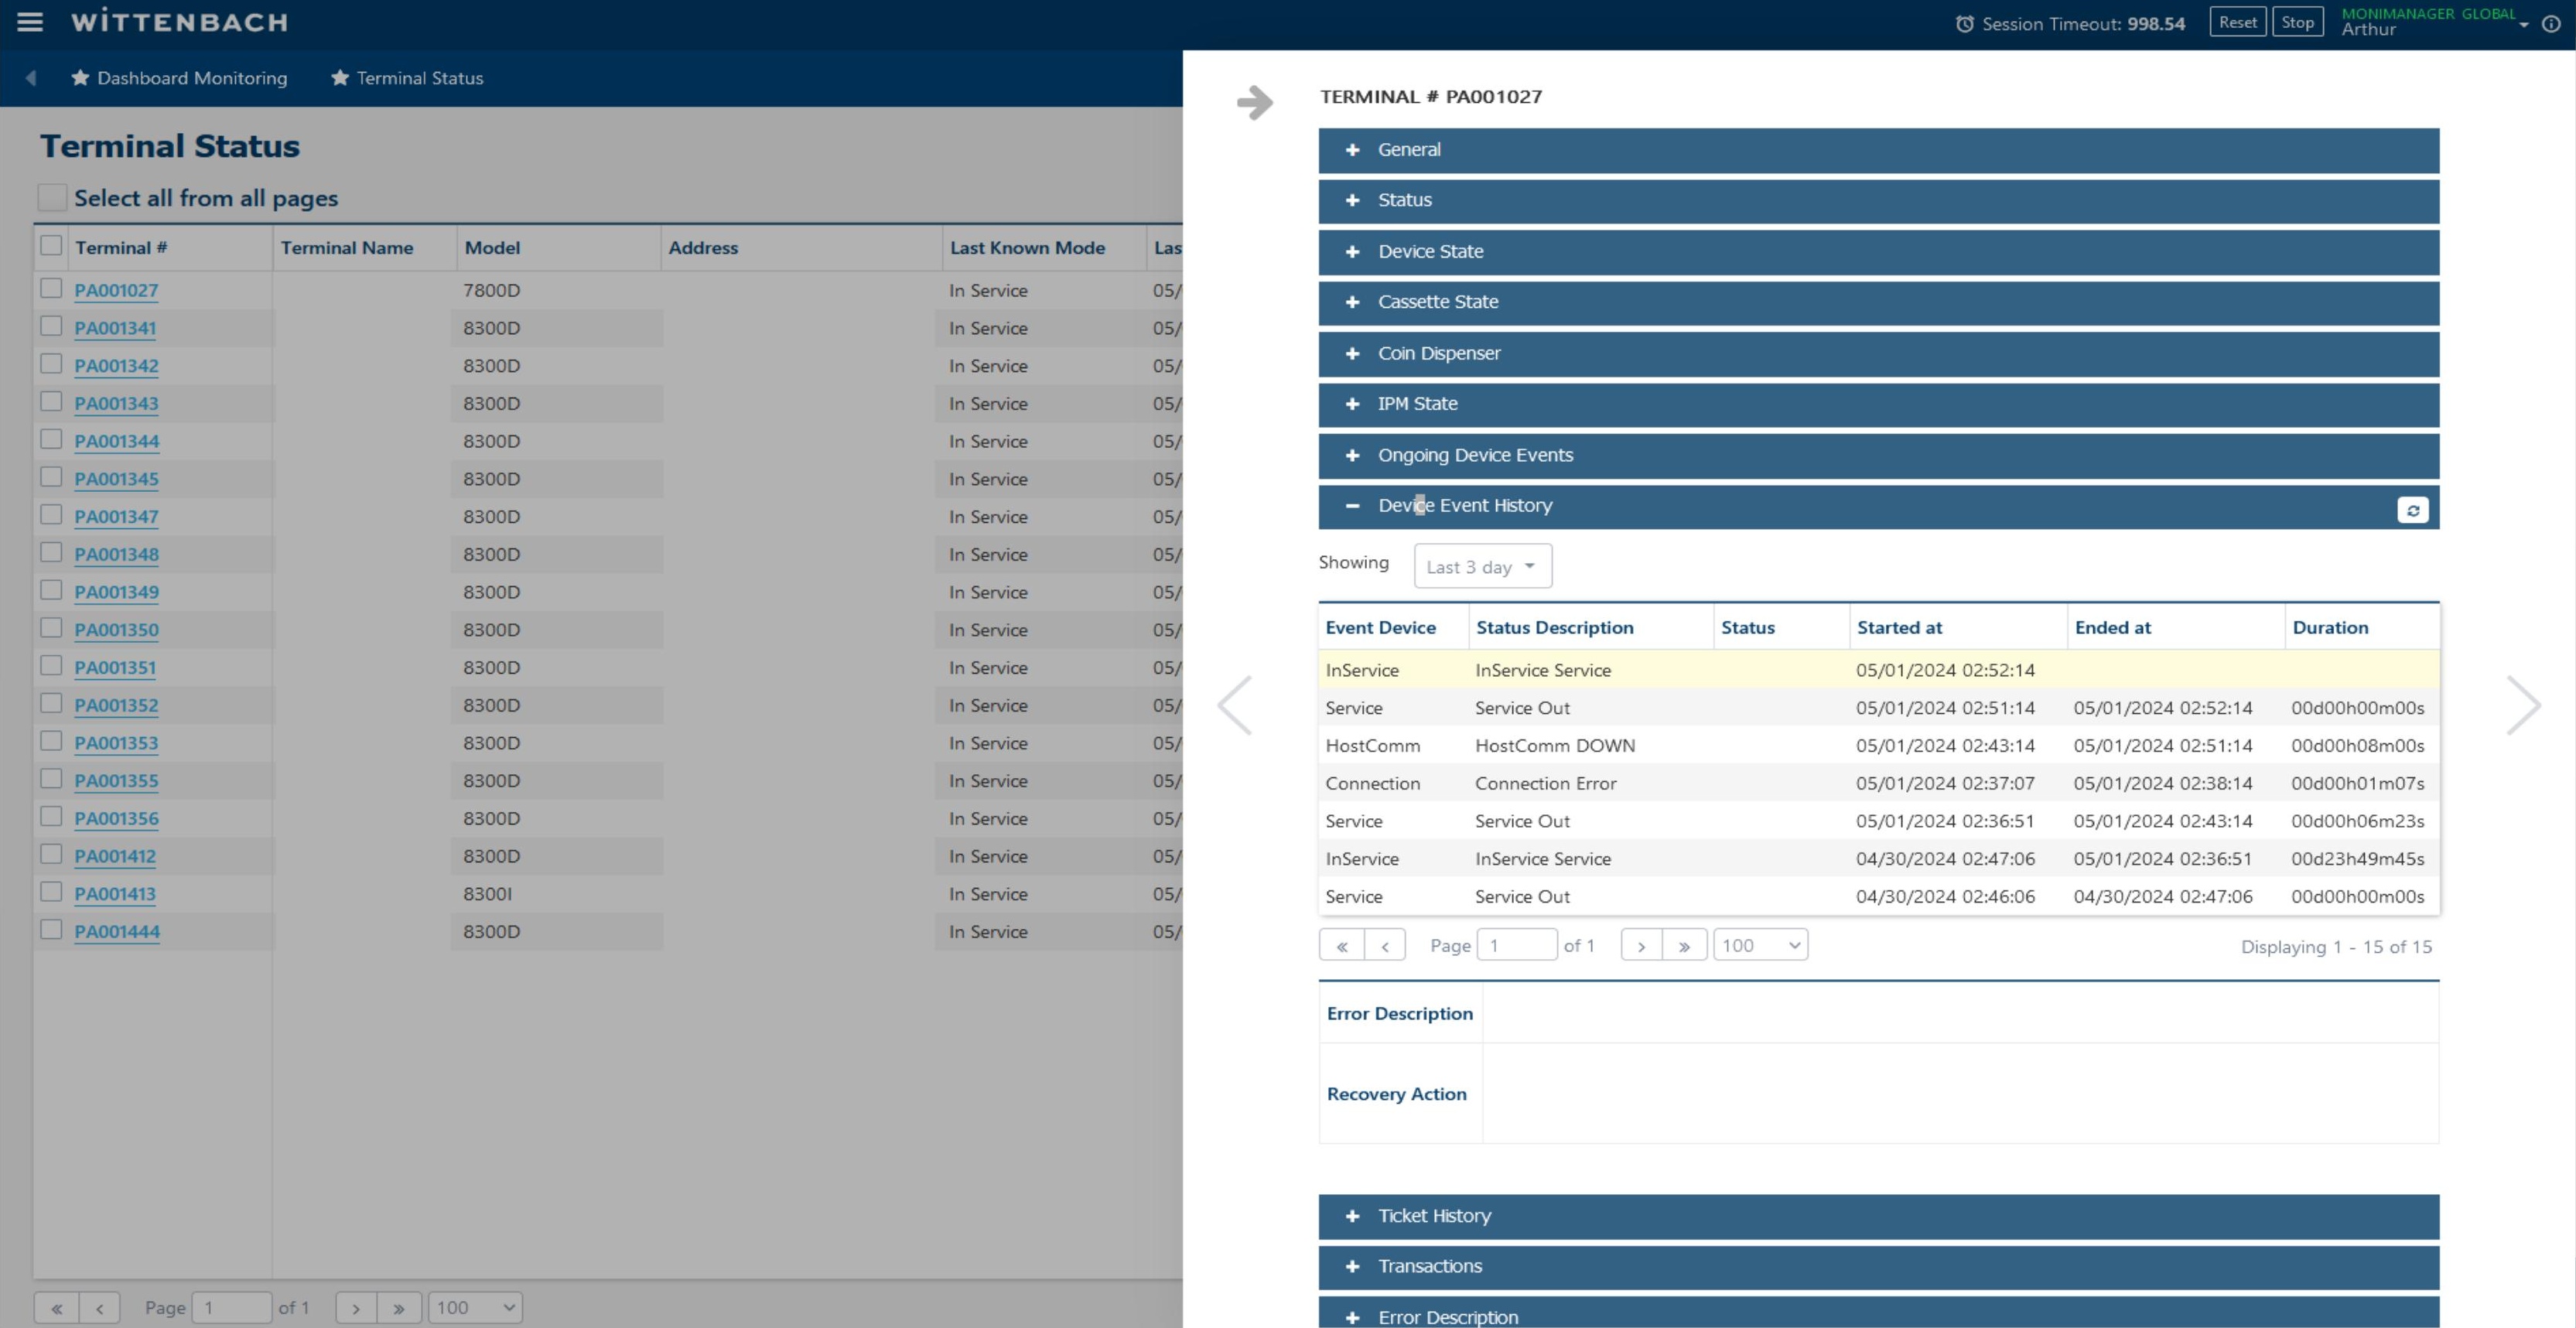
The Device Event History section provides a filterable log of all past events for this terminal. Use the Showing dropdown (e.g. Last 3 day, Last 7 day) to change the time window.
Columns include: Event Device, Status Description, Status, Started at, Ended at, and Duration. This is useful for identifying recurring faults or patterns before dispatching a technician.
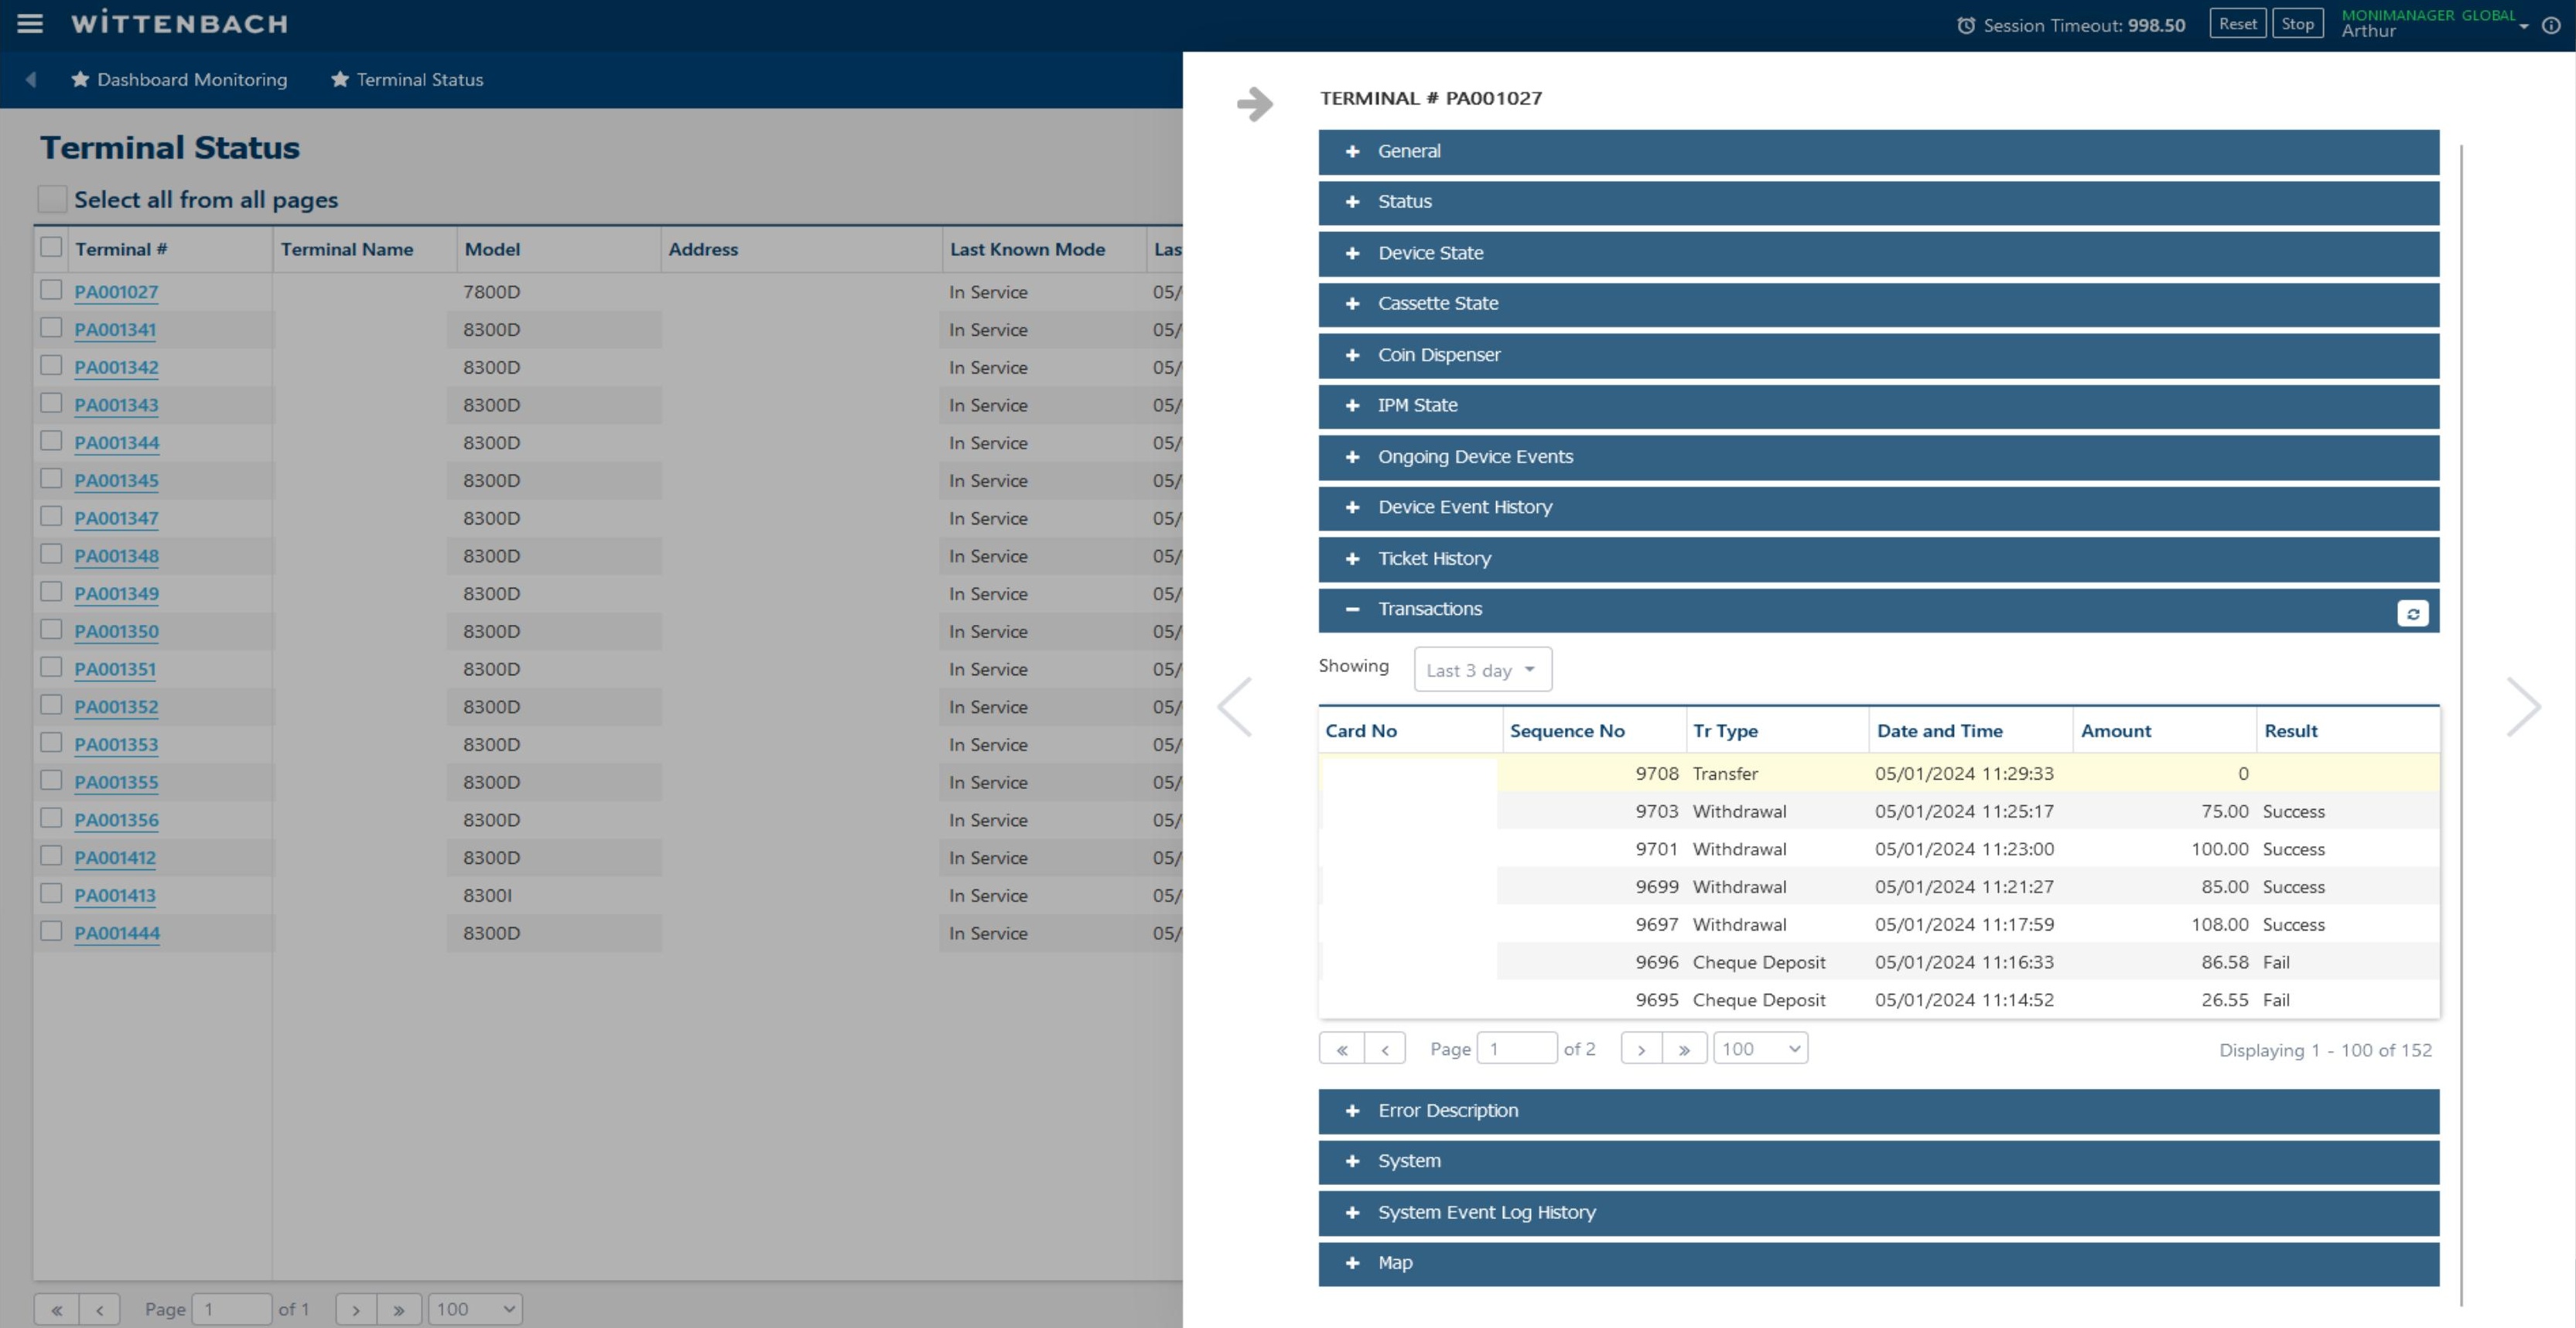
The Transactions section shows recent customer transactions for this terminal. Use the Showing dropdown to filter by date range.
| Column | Description |
|---|---|
| Card No | Masked card number (last 4 digits) |
| Sequence No | Transaction sequence number |
| Tr Type | Withdrawal, Cheque Deposit, Transfer, etc. |
| Date and Time | Transaction timestamp |
| Amount | Dollar amount |
| Result | Success or Fail |
The Error Description section maps the current fault to:
- Device — Which hardware component is affected
- Error Code — Numeric/alphanumeric fault code
- Error Description — Human-readable explanation
- Recovery Action — Recommended steps to resolve the fault
Use this section as your first diagnostic step before dispatching or calling a technician.
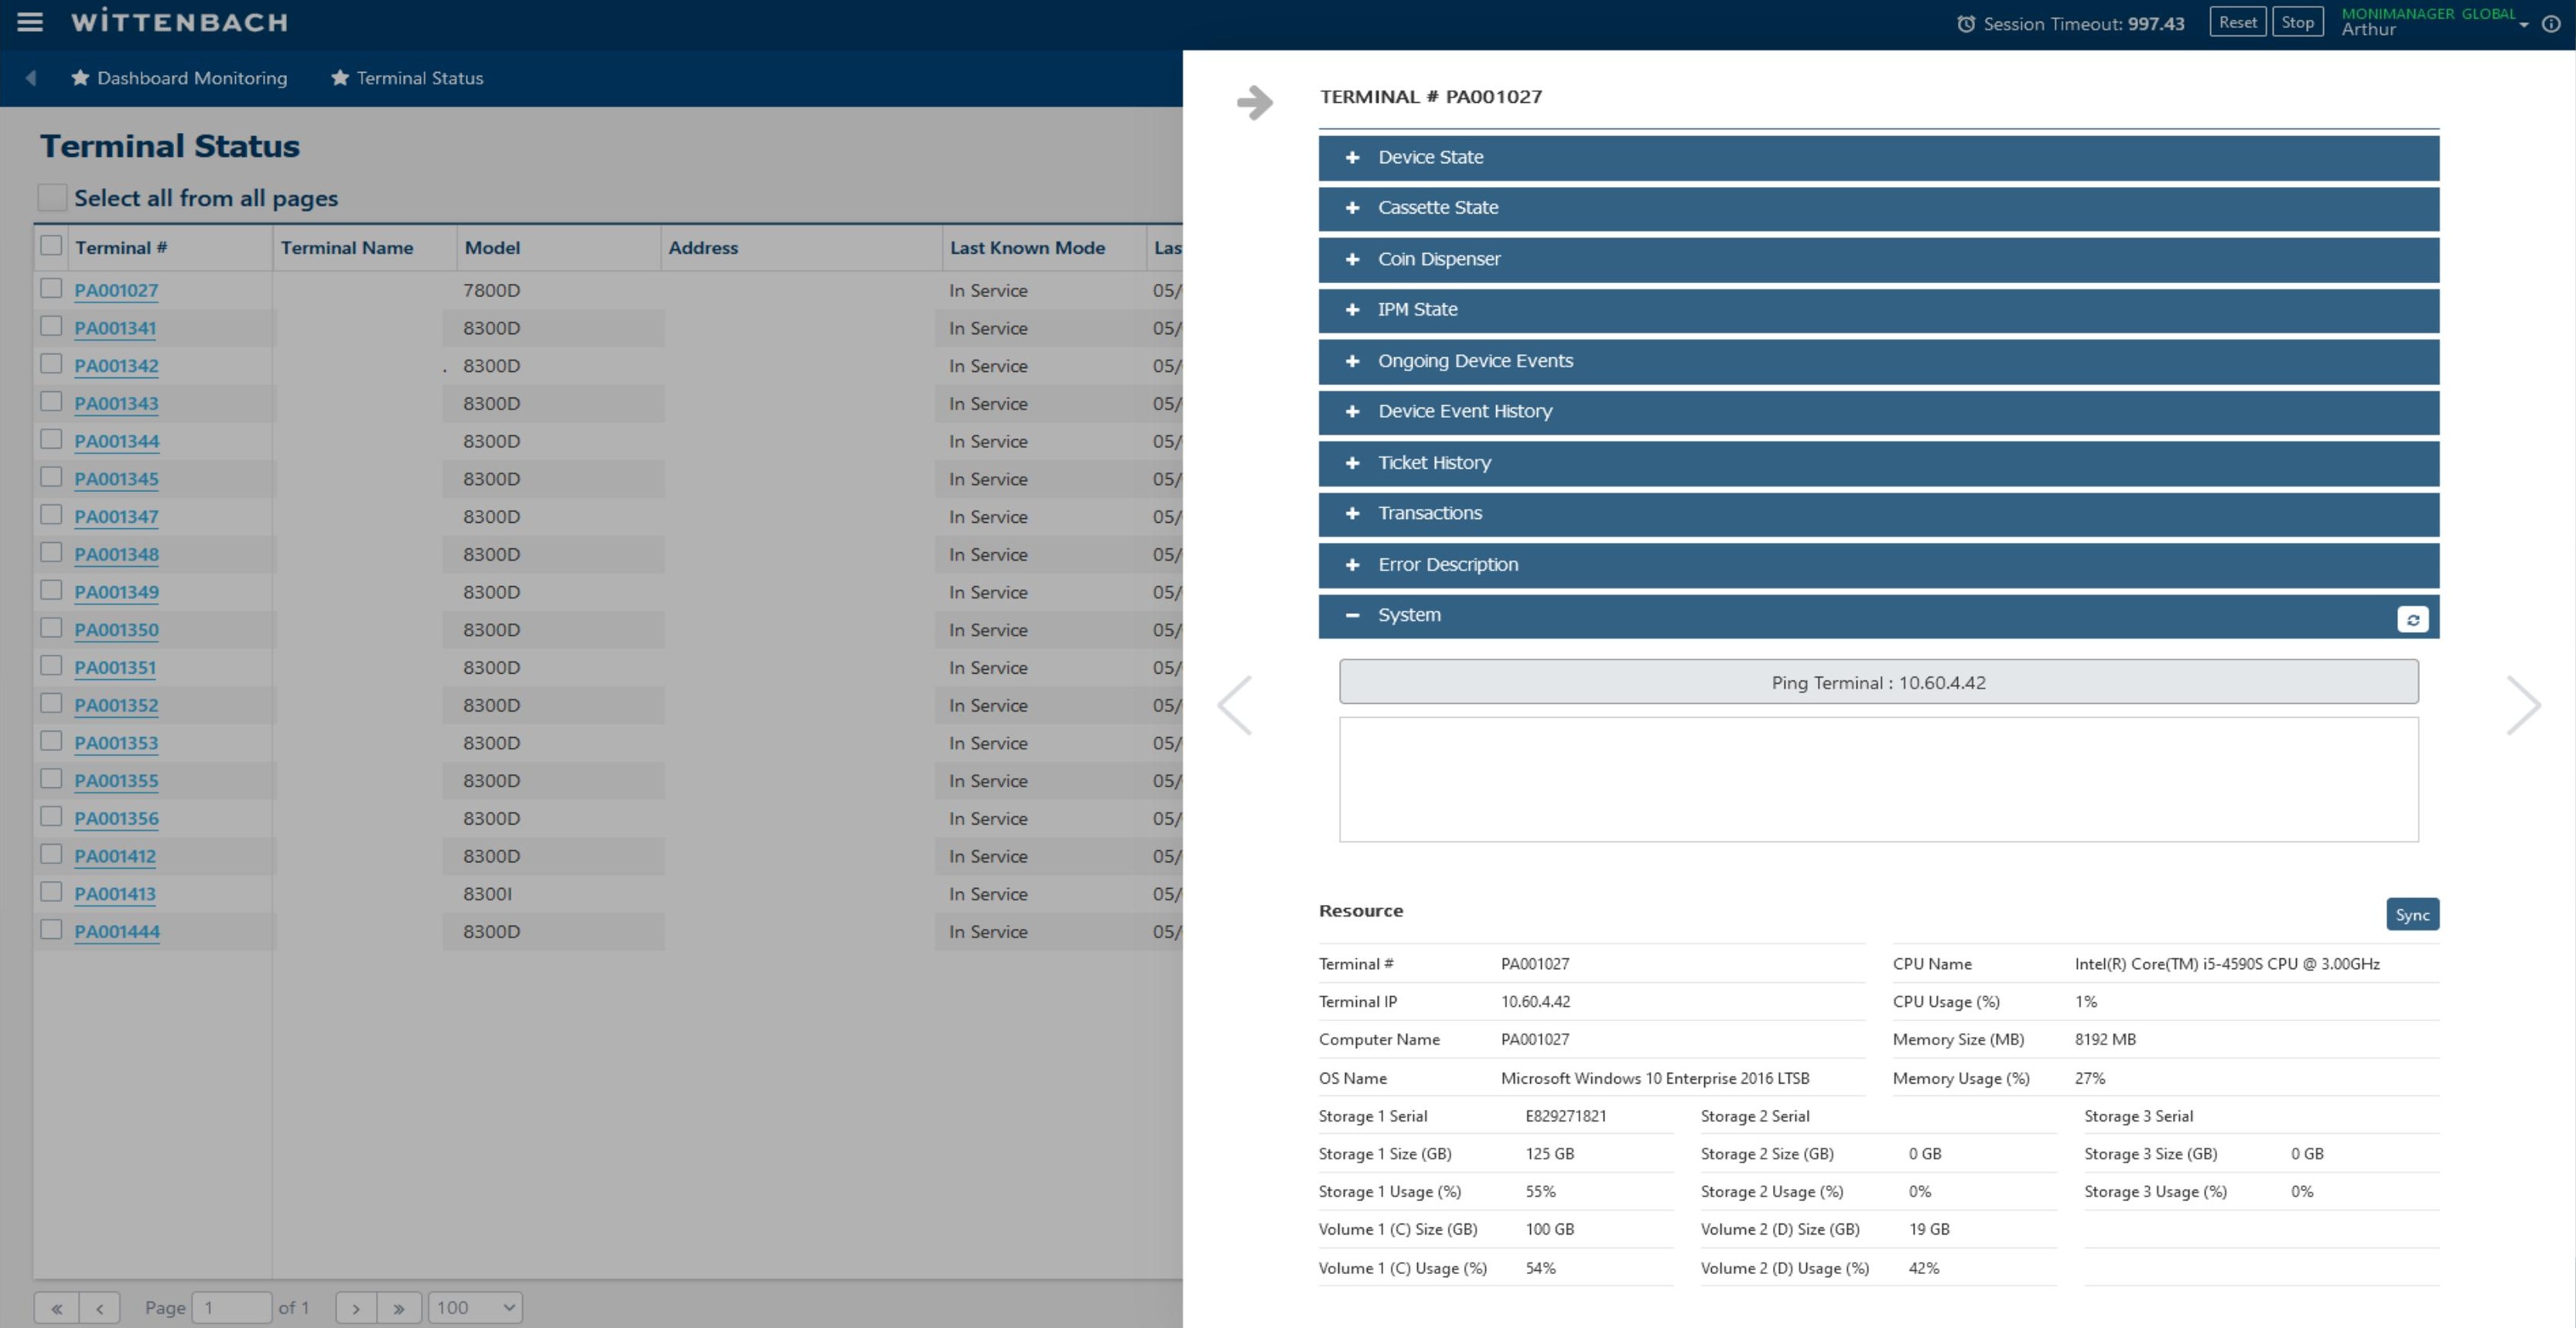
The System section provides system-level information and remote diagnostic tools:
The Ping Terminal button tests network connectivity to the ATM's IP address. The results appear in the output area below the button.
The Resource table shows:
| Field | Description |
|---|---|
| CPU Name / Usage (%) | Processor model and current load |
| Memory Size / Usage (%) | Total RAM and current utilization |
| OS Name | Windows version (e.g. Windows 10 Enterprise 2016 LTSB) |
| Storage 1–3 Size / Usage | Disk capacity and usage by drive |
| Volume C/D Size & Usage | Drive C and D partition usage |
Click Sync to refresh resource data from the terminal.
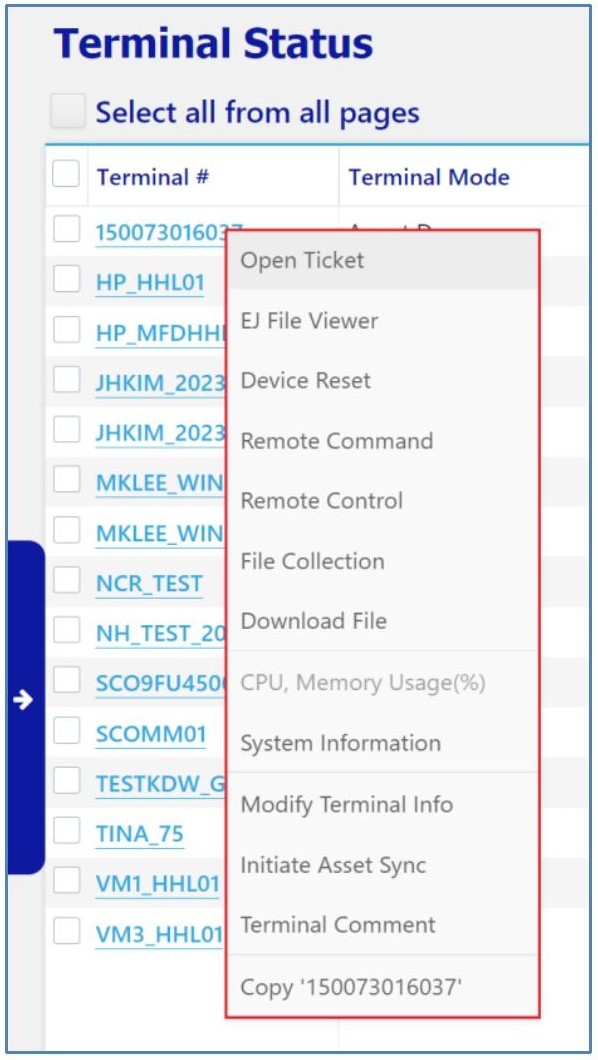
From the Terminal Status grid, check the checkbox next to a terminal row and then right-click (or look for the action icon) to reveal the context menu. Available actions:
- Open Ticket — Create a service ticket for this terminal
- EJ File Viewer — Open the Electronic Journal for this terminal
- Device Reset — Reset specific hardware components
- Remote Command — Send a reboot or other command
- Remote Control — Open VNC/remote screen view
- File Collection — Retrieve log files from the terminal
- Download File — Push a file/update to the terminal
- CPU, Memory Usage(%) — Live performance chart
- System Information — OS, hotfix, program, service details
- Modify Terminal Info — Edit terminal metadata
- Initiate Asset Sync — Force an asset data refresh
- Terminal Comment — Add a note to the terminal record
- Copy [Terminal #] — Copy the terminal ID to clipboard
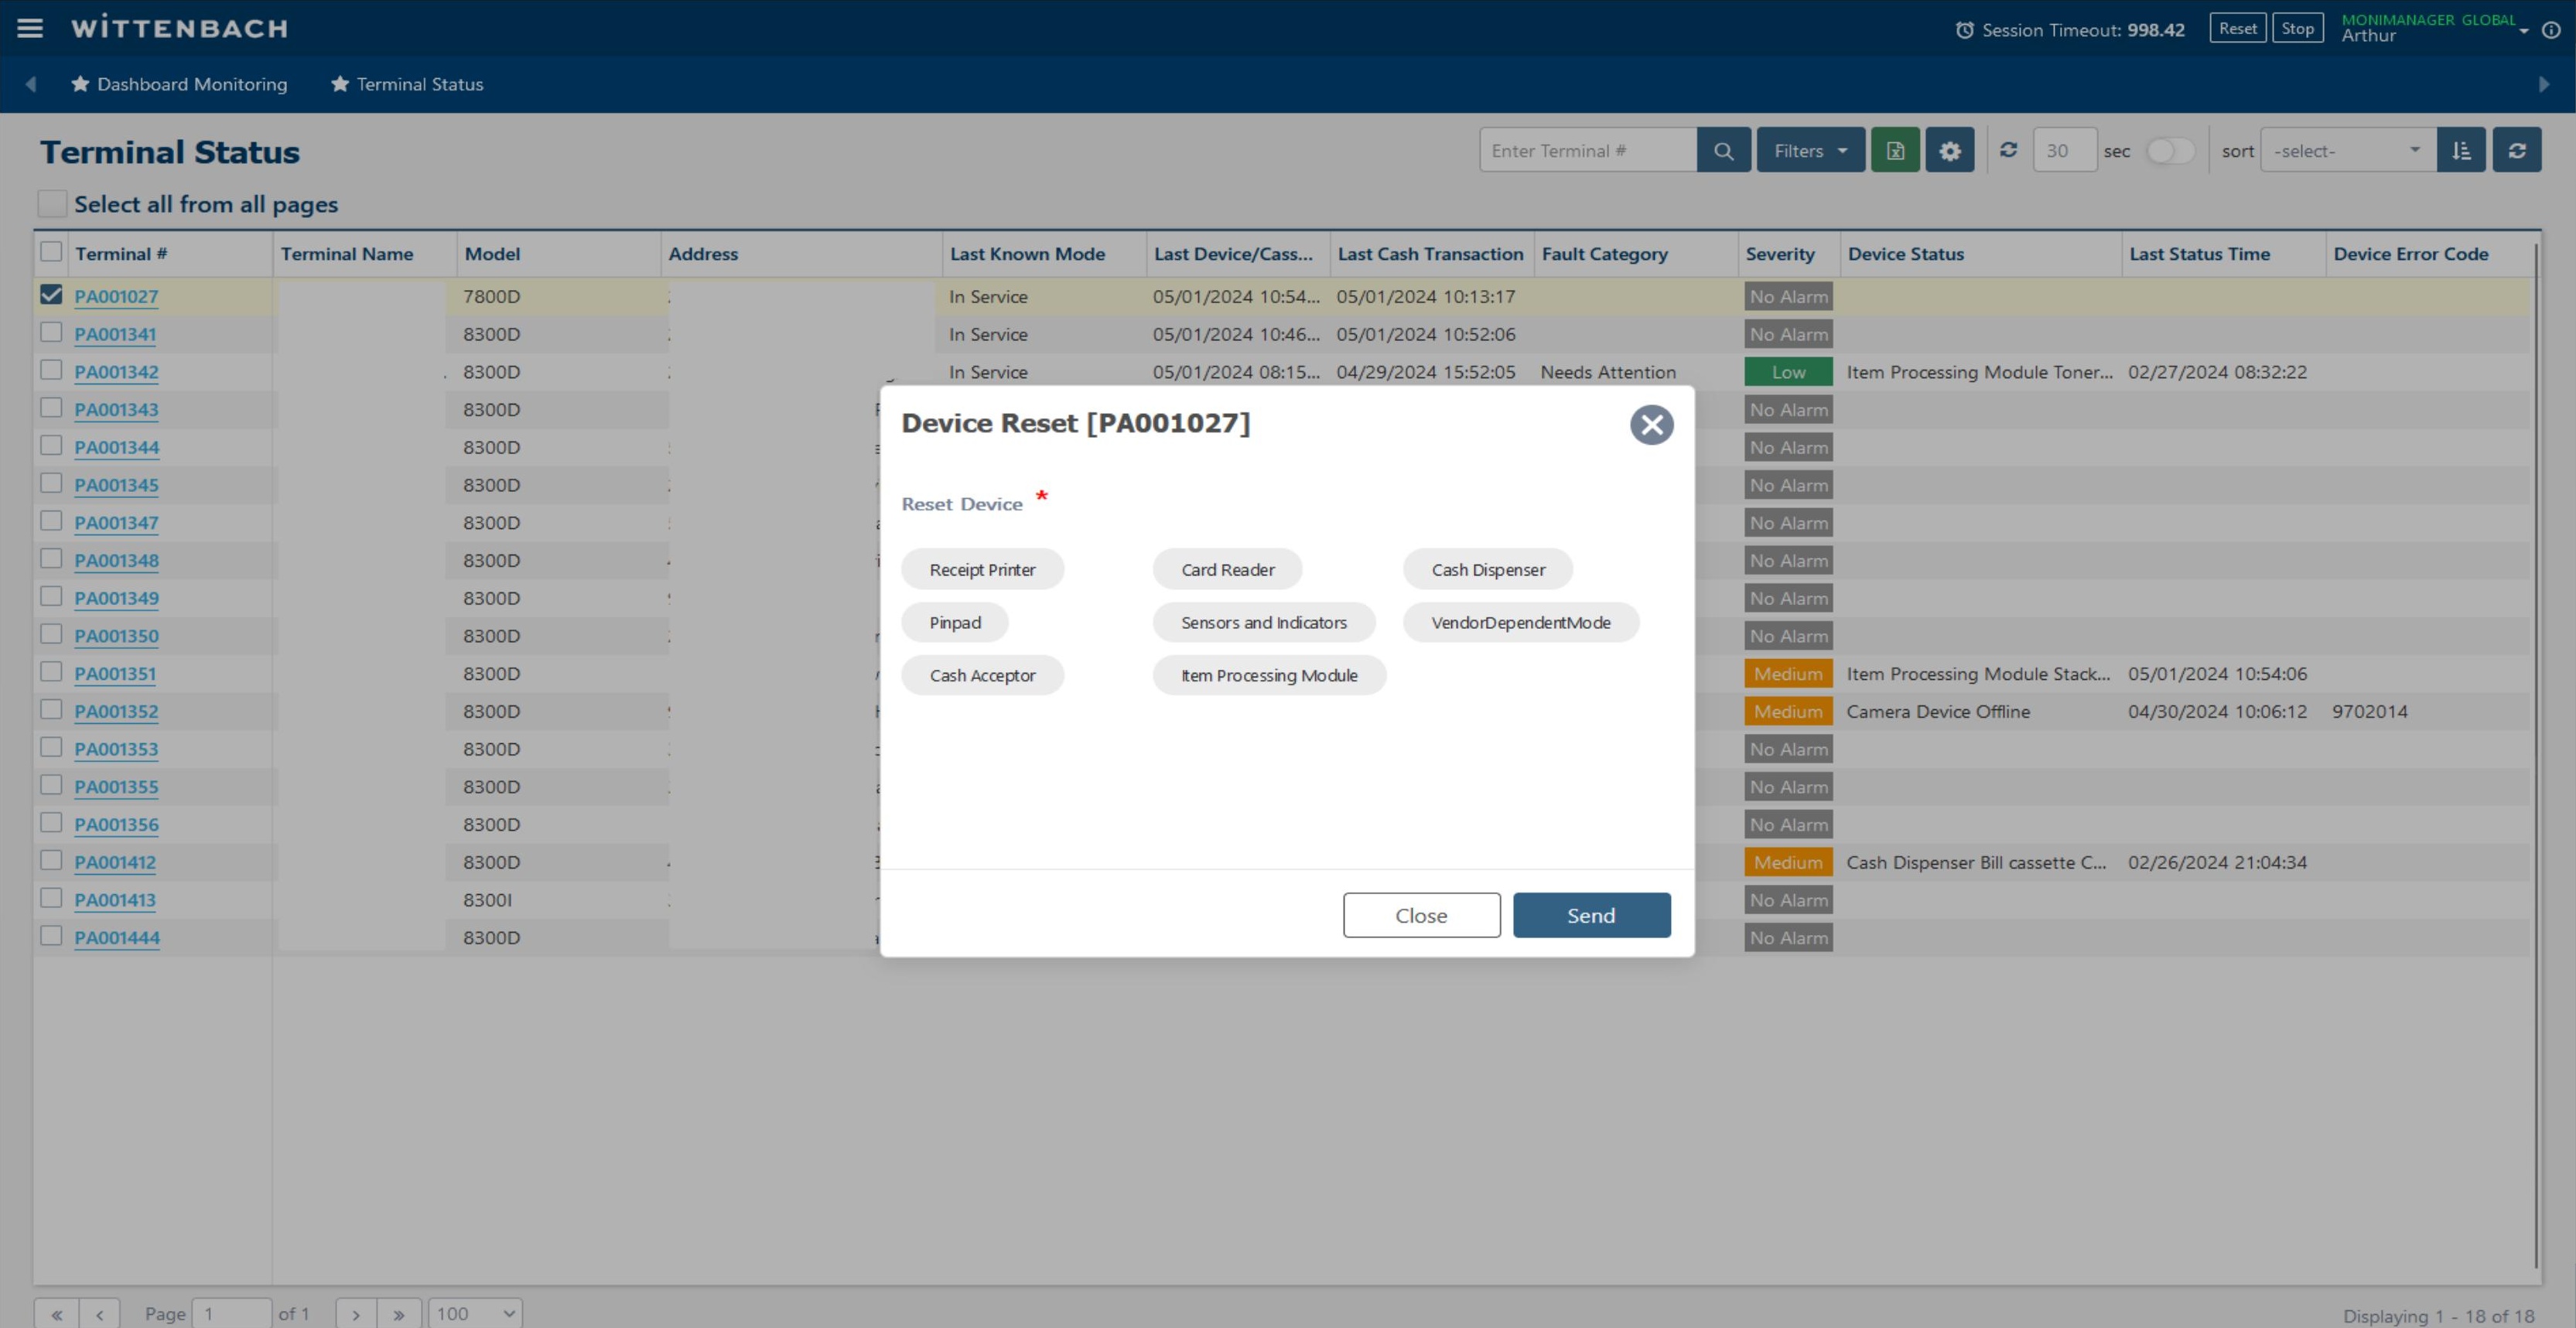
Select Device Reset from the context menu to open the Device Reset dialog. Select one or more devices to reset, then click Send.
Resettable devices:
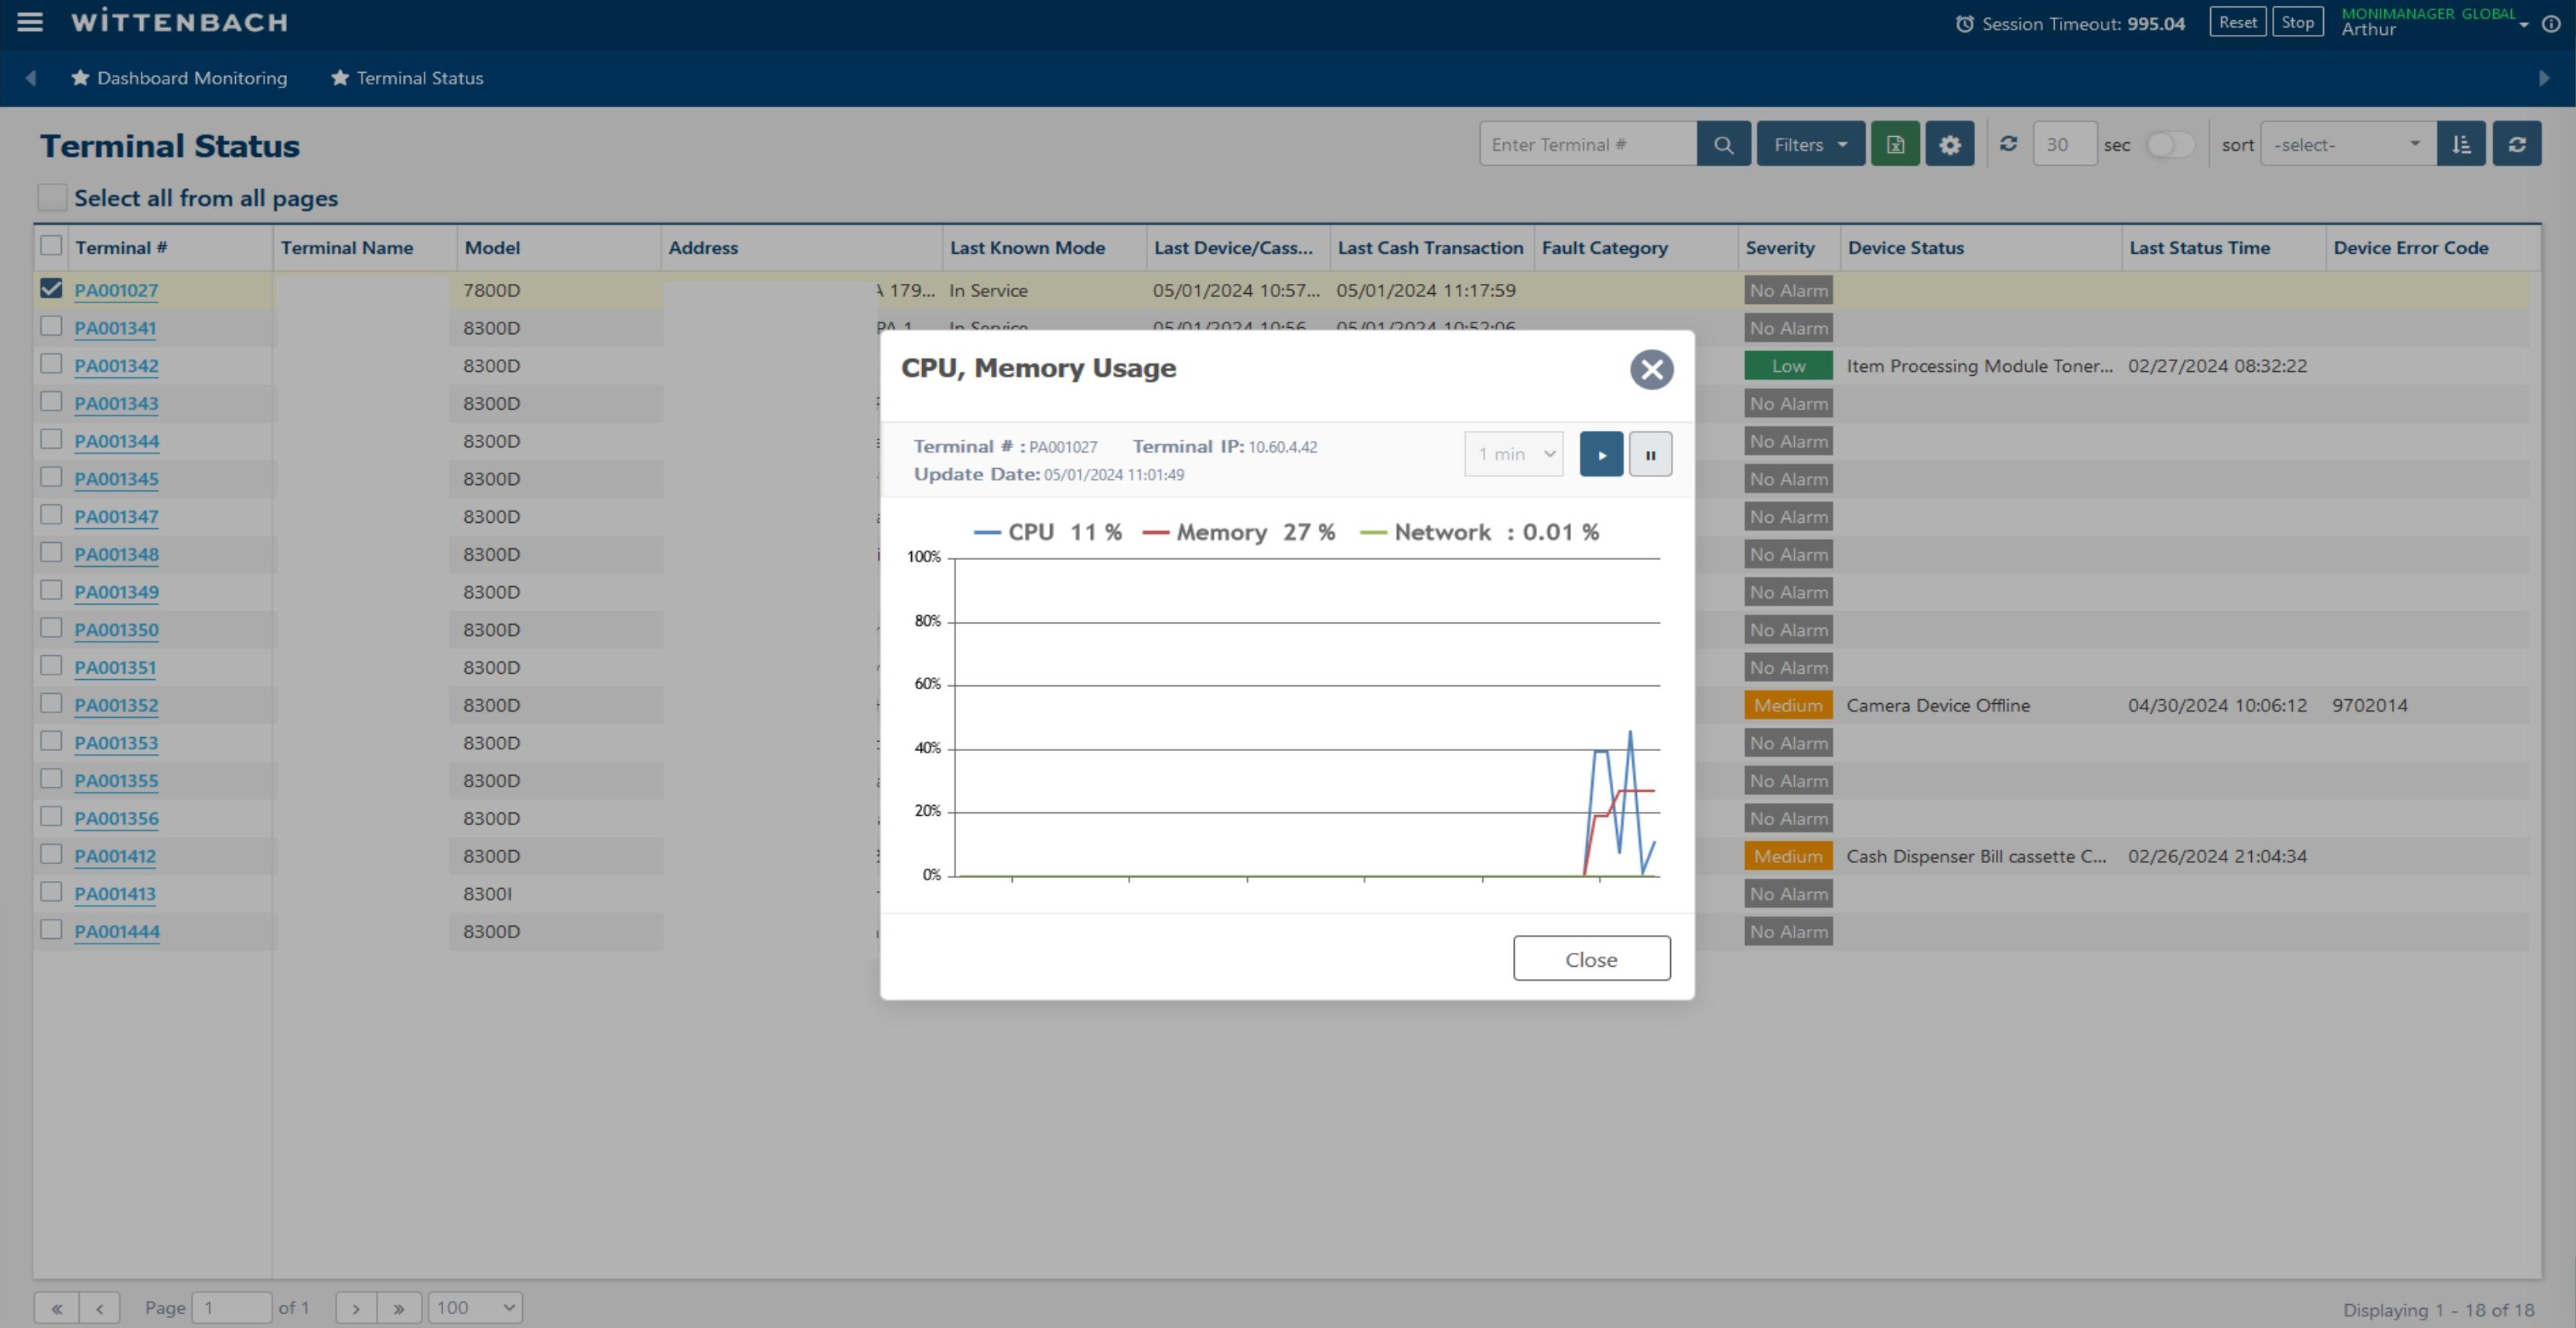
Select CPU, Memory Usage(%) from the context menu to open a live performance chart. The chart displays:
| Metric | Color | Description |
|---|---|---|
| CPU | Blue line | CPU utilization % over time |
| Memory | Red line | RAM usage % over time |
| Network | Gold line | Network I/O activity |
Use the time interval dropdown (1 min, 5 min, etc.) to change the chart resolution. Use the Play/Pause buttons to control live updates.
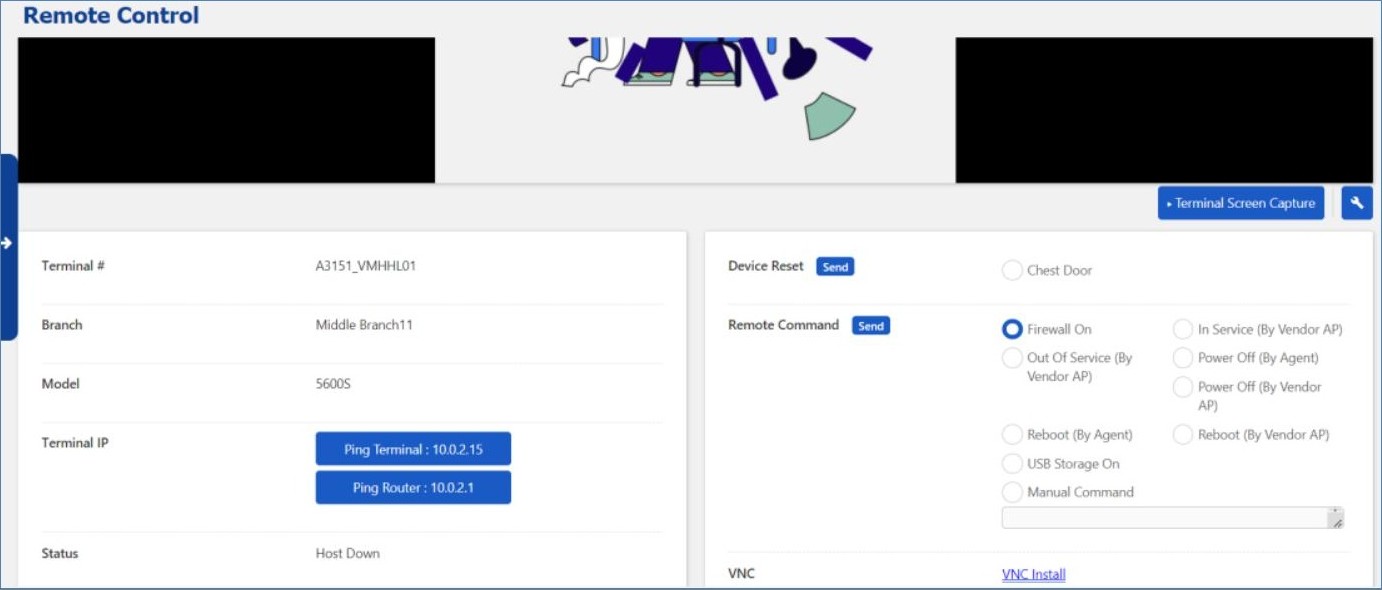
Select Remote Control from the context menu to open the full remote management interface. This page provides:
- Live ATM screen view — Shows the current ATM display (Hyosung TNS diagnostics or customer-facing screen)
- Terminal Screen Capture — Save a screenshot of the current ATM screen
- Device Reset panel — Reset individual components
- Remote Command — Reboot by Agent
- VNC — Install VNC or use VNC for File Transfer or full Remote Control
- Ping Terminal / Ping Router — Network connectivity tests
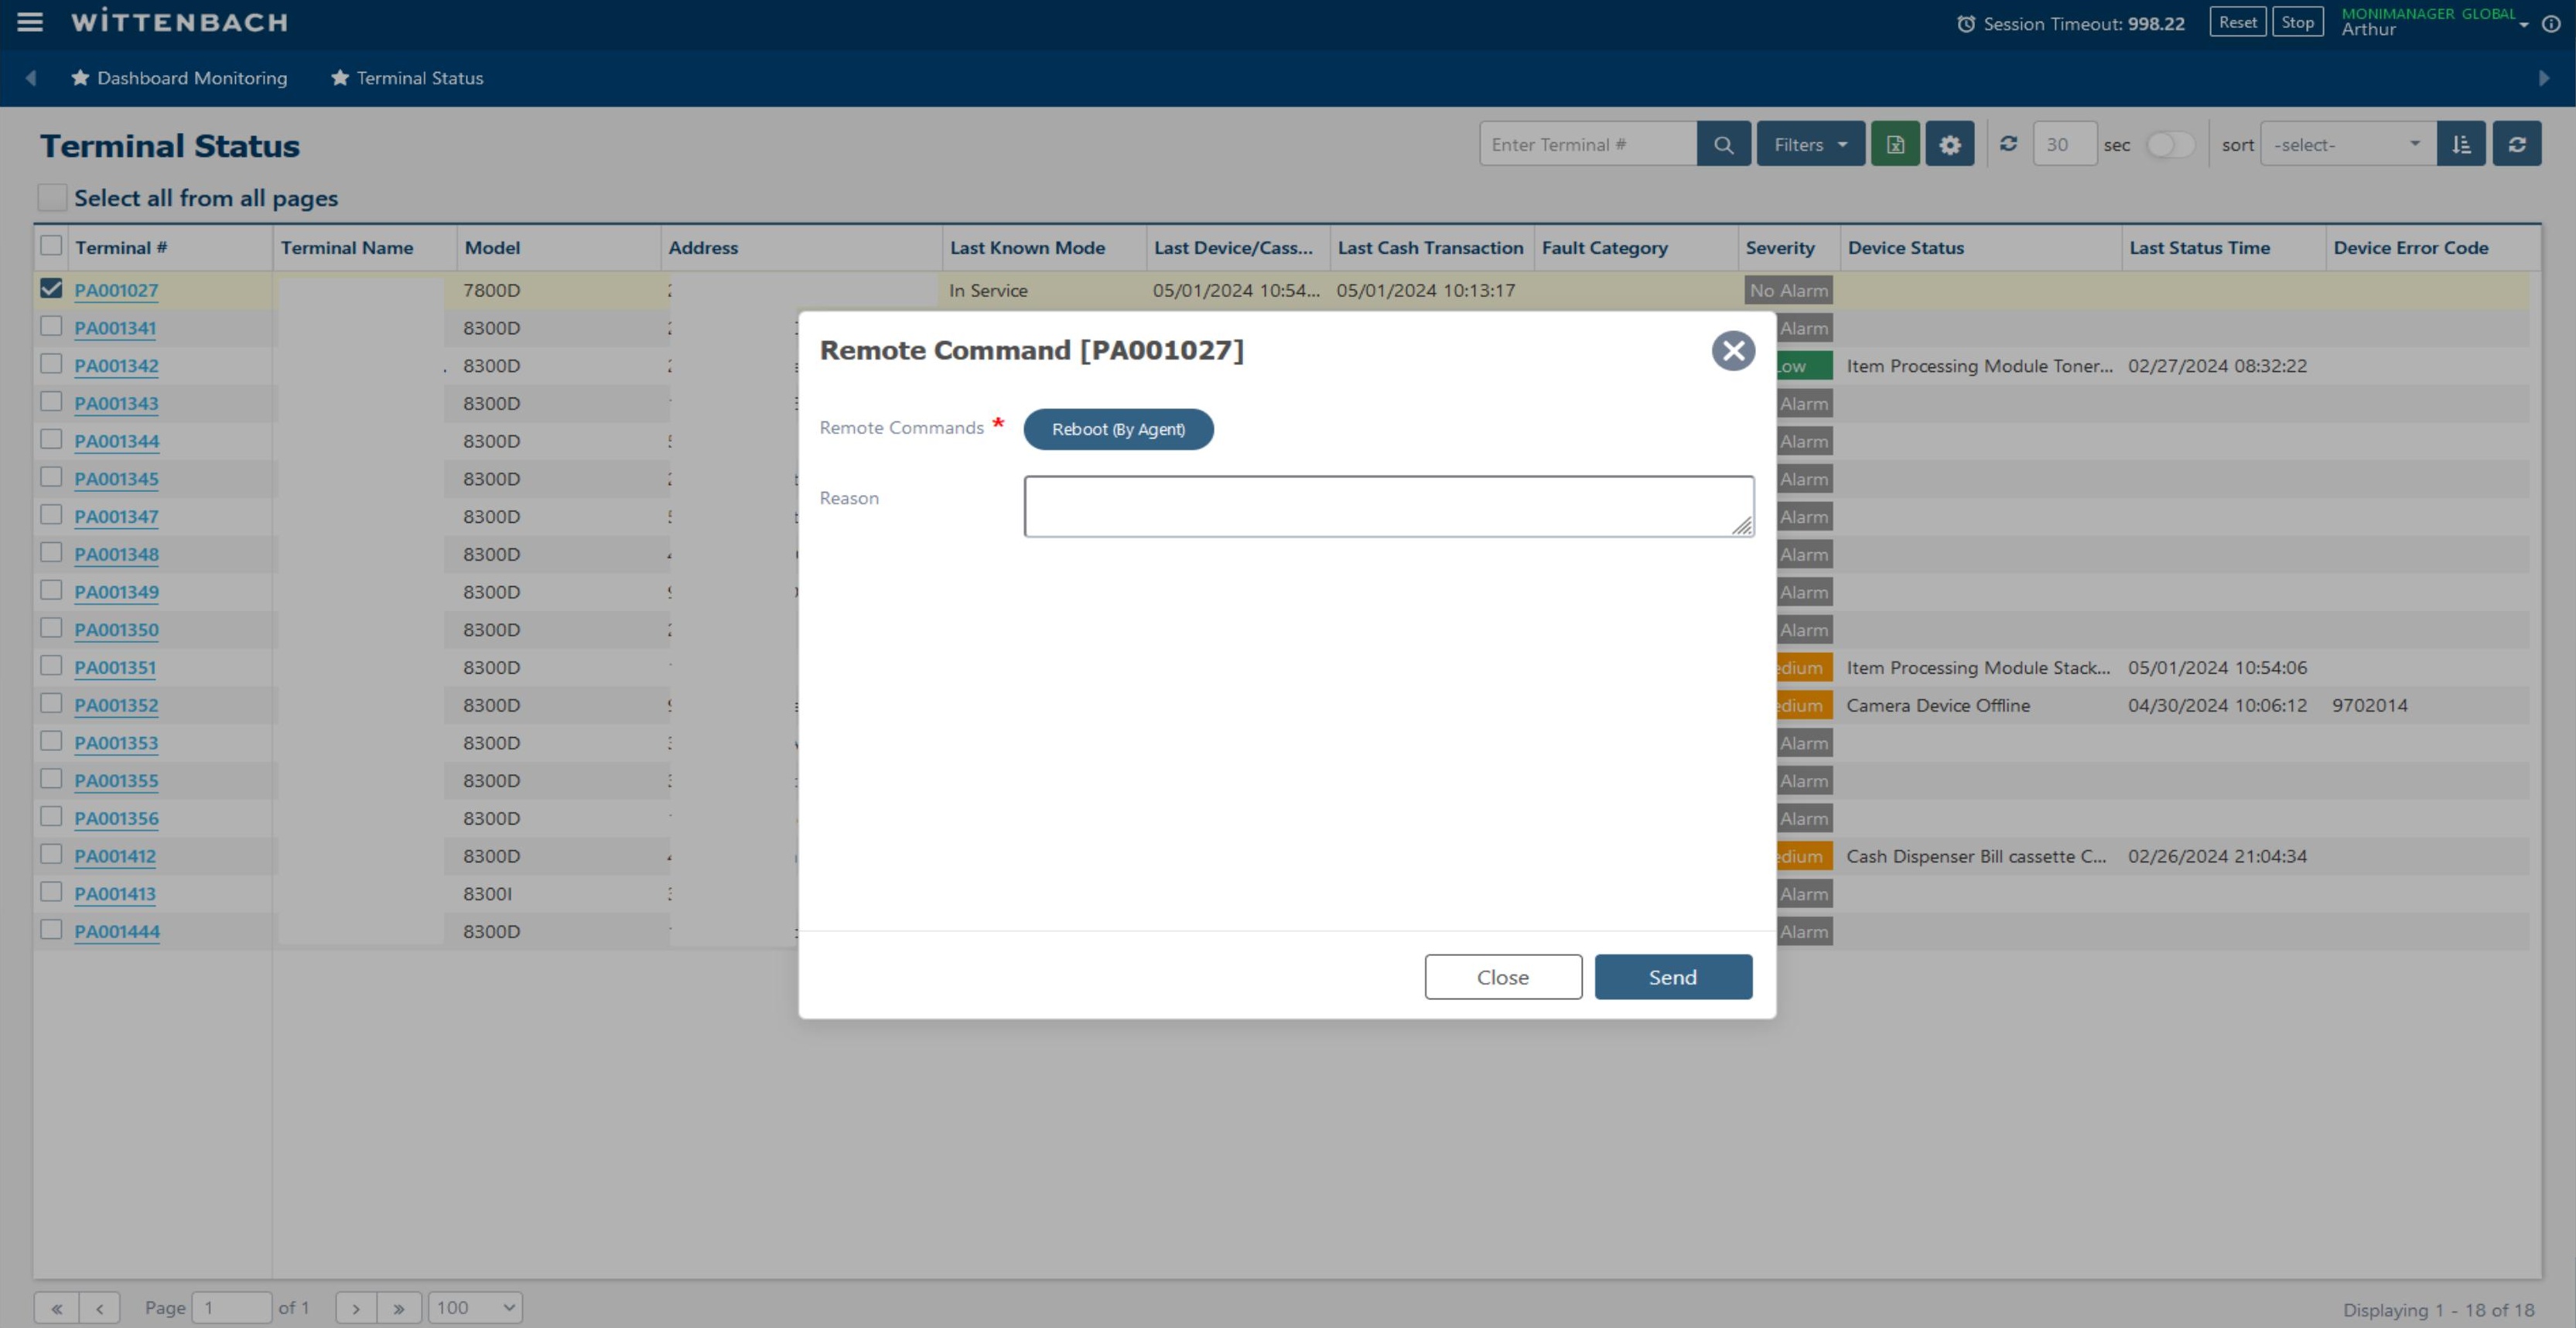
To reboot an ATM remotely, select Remote Command from either the context menu or the Remote Control page. The dialog shows:
- Remote Commands — Select Reboot (By Agent)
- Reason — Enter a reason for the reboot (optional but recommended for audit trail)
Click Send to execute. The ATM agent will receive the command and reboot the terminal. Allow 3–5 minutes for the terminal to come back online.
Access the EJ File Viewer by:
- Right-clicking a terminal in the grid and selecting EJ File Viewer, or
- Navigating from the main menu: Journal and Transaction → EJ File Viewer
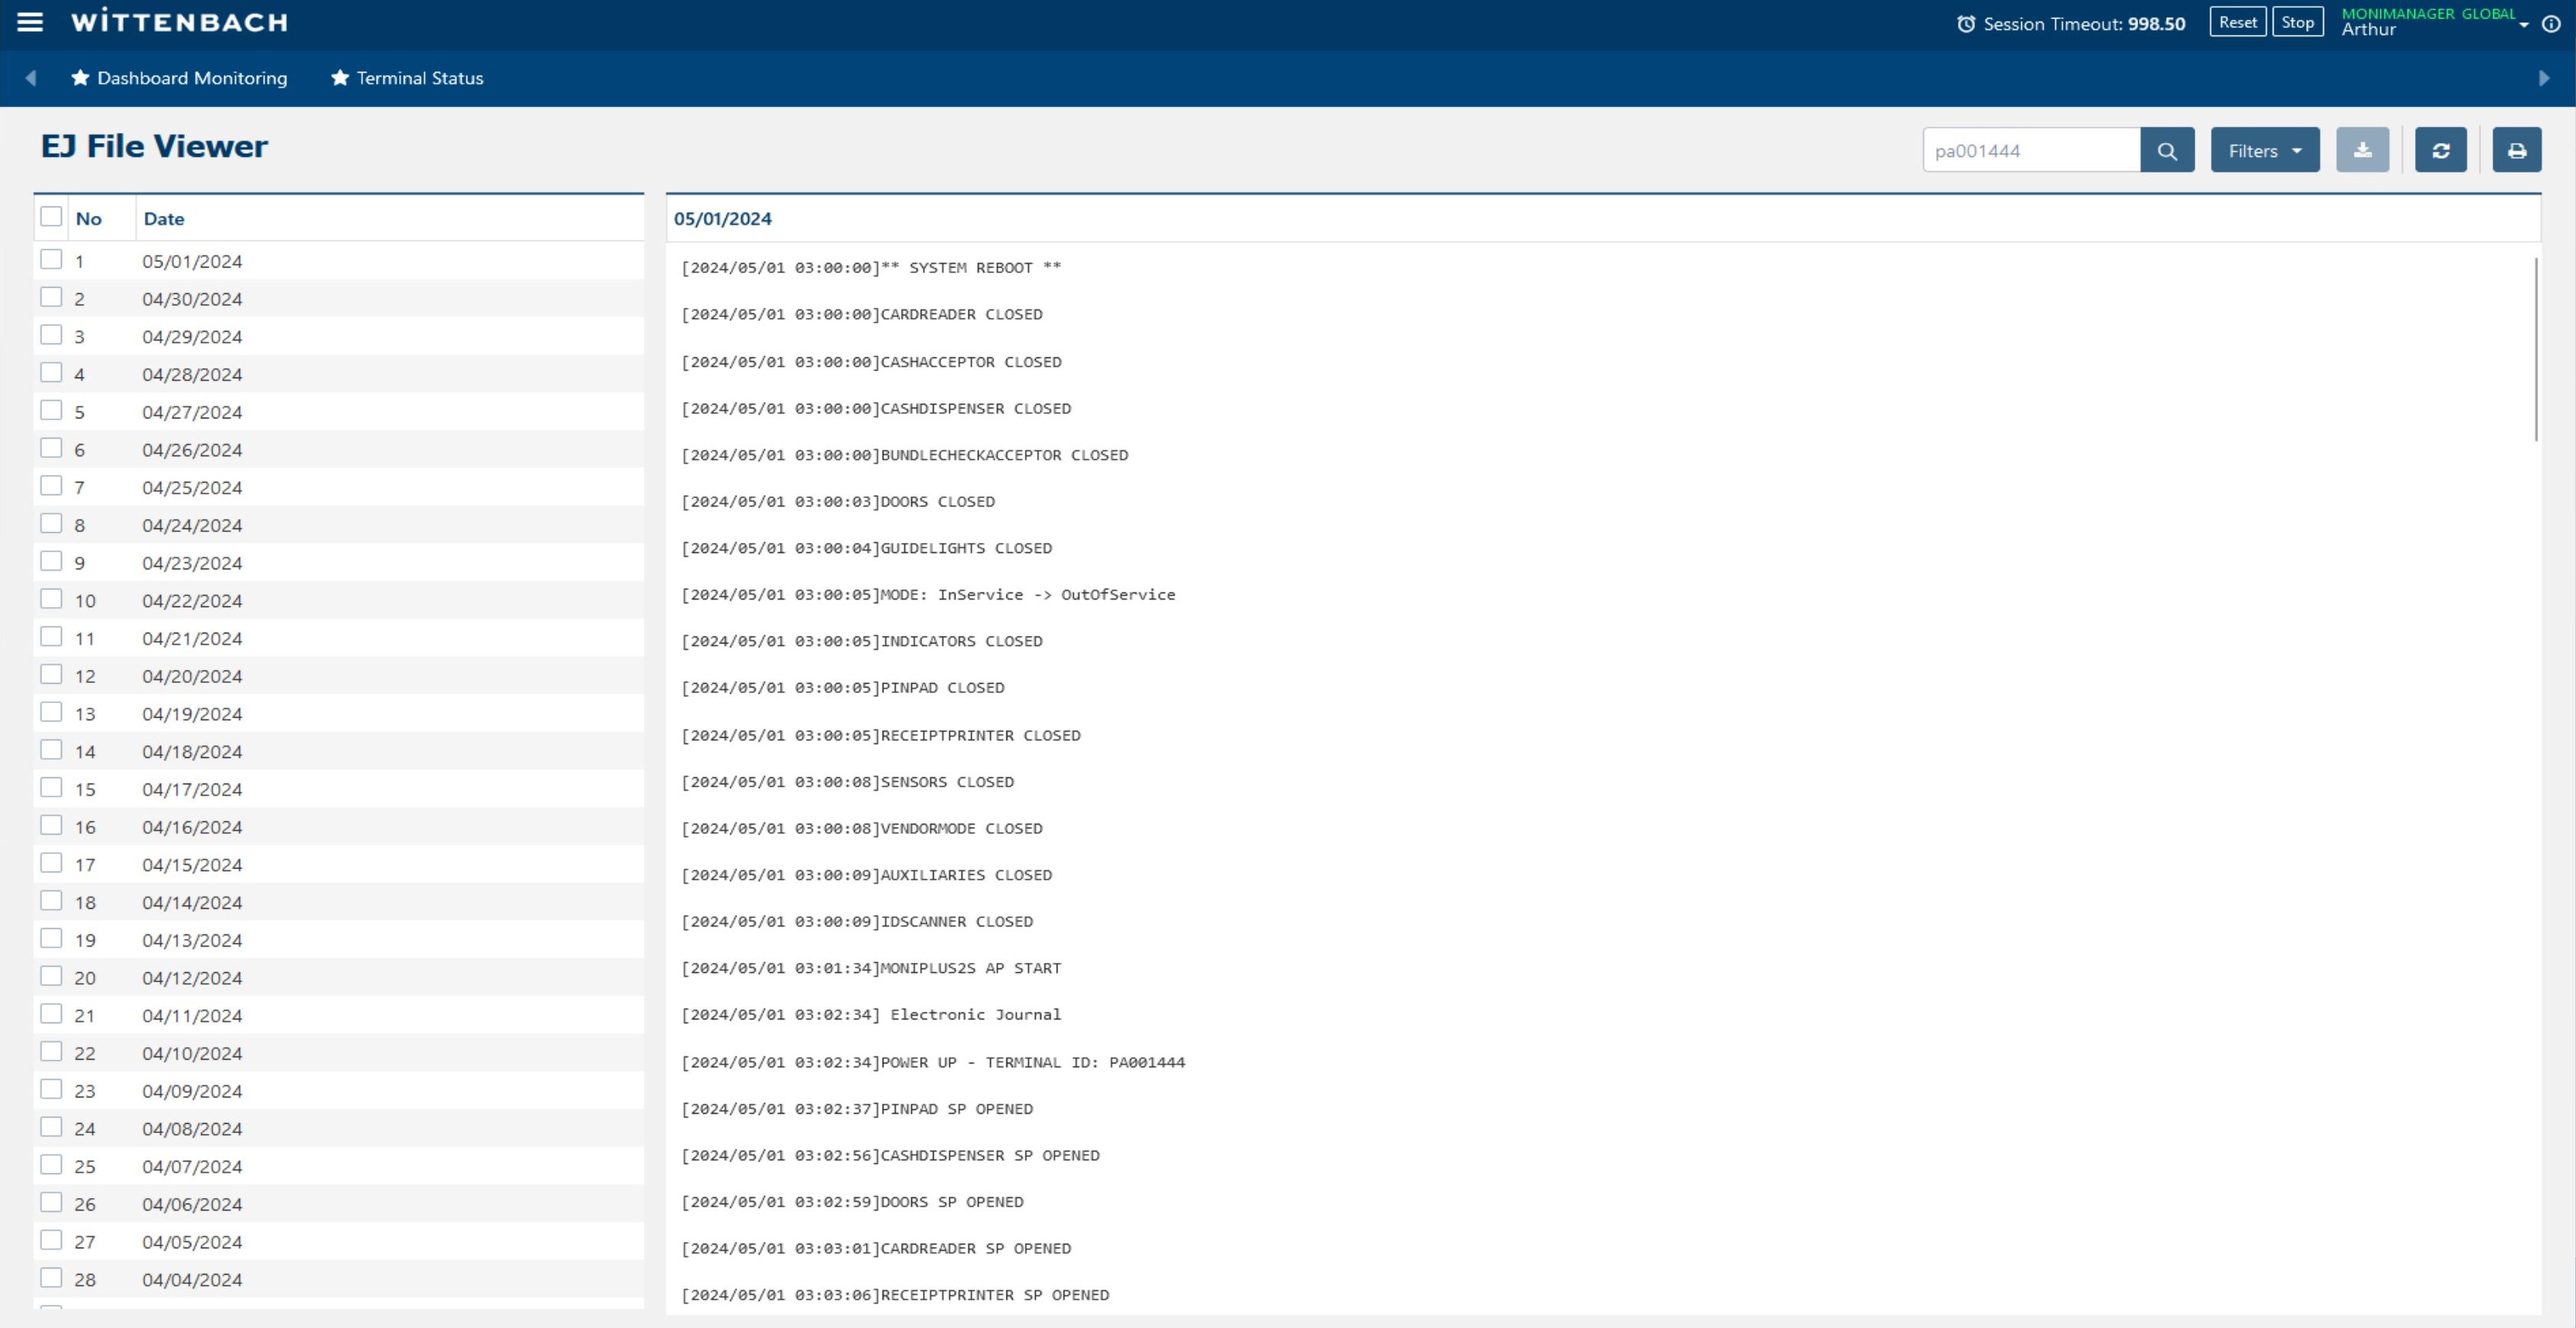
The left panel shows a list of available EJ dates (most recent at top). Click a date to load that day's journal in the right pane.
The right panel shows raw EJ log entries including system reboots, component open/close sequences, power-up events, and transaction markers. Use the search bar (top-right) to search by terminal number.
The EJ File List page is separate from the EJ File Viewer and is designed for downloading EJ files to your local computer rather than viewing them on-screen.
Navigate to: Journal and Transaction → EJ File List
Each row in the table represents one EJ file pulled from a terminal. To download:
- Use the Terminal Number search box to find all EJ files for a specific terminal
- Sort by Terminal #, EJ Date, or Last Uploaded Time to locate the files you need
- Check one or more row checkboxes, then click the Download icon in the top-right corner
- BlueVerse downloads a ZIP file — single-file downloads include the terminal # in the filename (e.g.
PA001027_20240501.txt); multi-file downloads use the page name, operator ID, date, and time
BlueVerse automatically pulls EJ files from terminals on a periodic schedule. You can monitor the status and handle failures via:
Journal and Transaction → EJ Pulling → EJ Pulling Dashboard
The dashboard shows EJ pulling success/failure counts per bank per day. Click a red Fail link to see the list of terminals that failed for that day, along with their Agent Status and last upload date.
Common reasons for EJ pull failure:
| Reason | What to do |
|---|---|
| Agent is not connected to server | Check terminal connectivity; the Agent is offline — verify network and ATM Agent status |
| Customer in transaction | Normal — BlueVerse automatically retries 1 minute after the transaction completes |
Manually uploading a missed EJ file: If automatic pulling failed for a specific terminal and date, you can manually upload that terminal's EJ file:
- Navigate to Journal and Transaction → EJ Pulling → EJ Pulling History
- Click the Upload button in the top-right corner
- Select the terminal and browse to the local EJ ZIP file
- Click Submit — the file will be available in the EJ File Viewer once processed
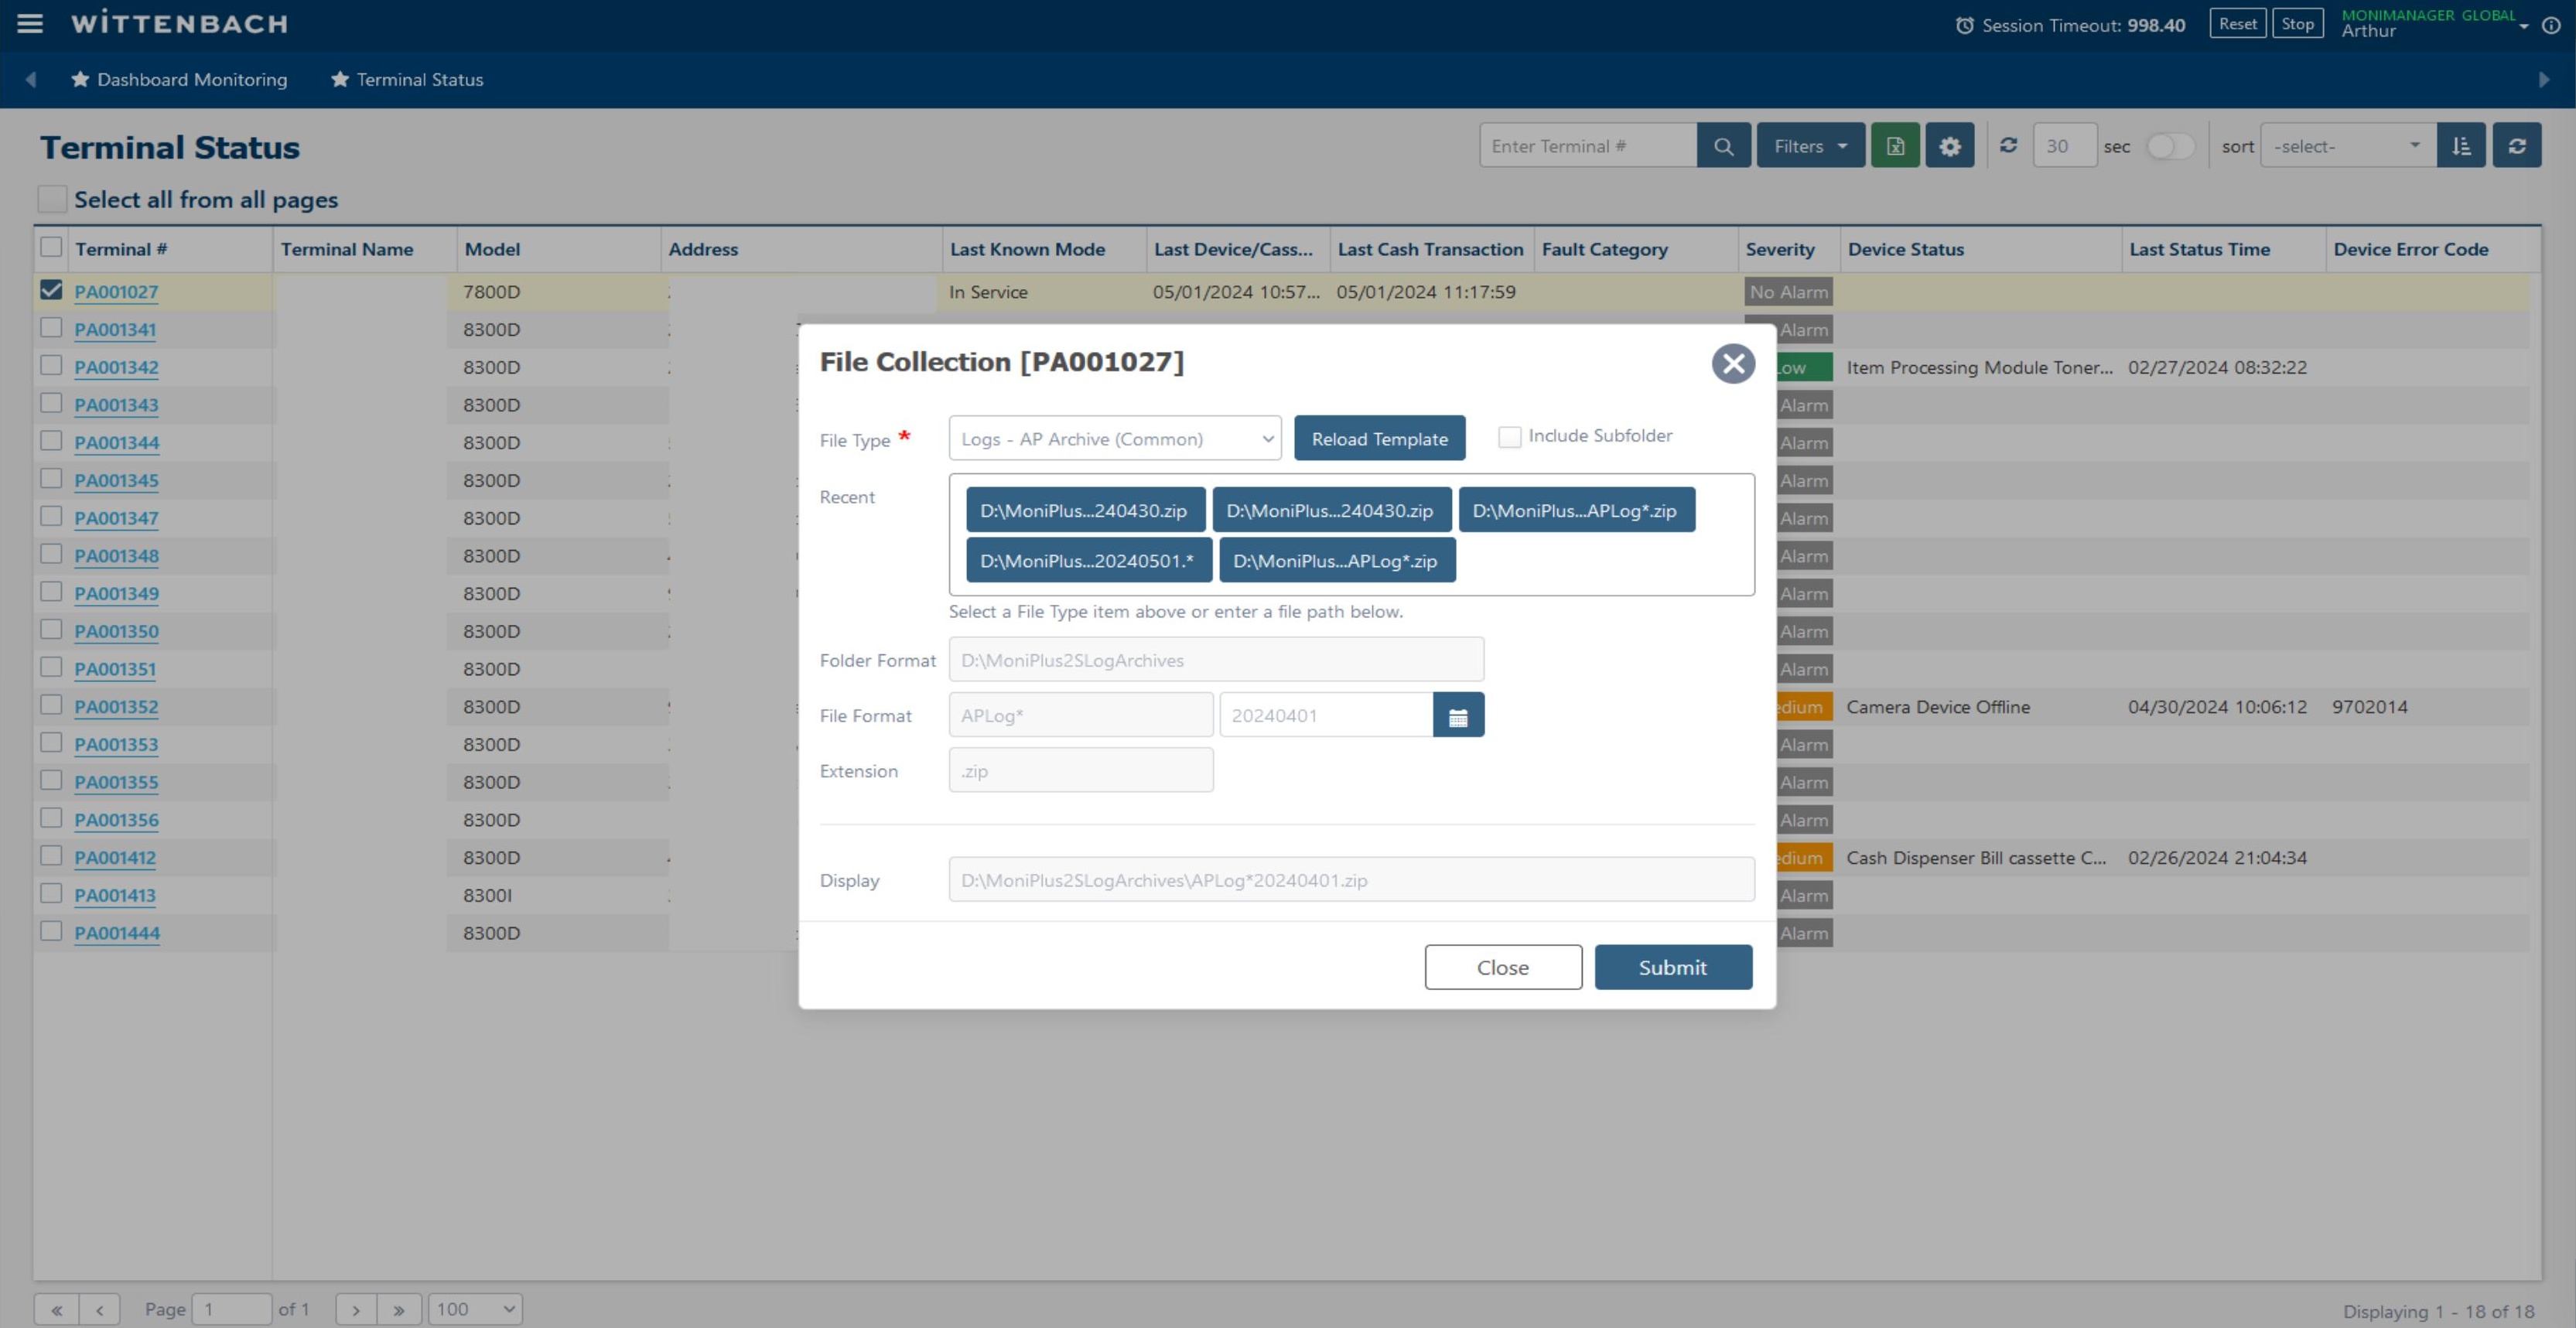
Select File Collection from the context menu to open the file collection dialog. This allows you to request specific files from the terminal agent.
| Field | Description |
|---|---|
| File Type | Select from presets (e.g. Logs – AP Archive (Common)) |
| Reload Template | Refreshes the path fields based on the selected File Type |
| Include Subfolder | Check to include subdirectories in collection |
| Recent | Quick-select buttons for recently used file patterns |
| Folder Format | Path on the terminal (e.g. D:\MoniPlus2S\LogArchives) |
| File Format | Filename pattern (e.g. APLog*) |
| Extension | File extension (e.g. zip) |
Click Submit to queue the collection job. The agent will retrieve and upload the files to MoniManager for download.
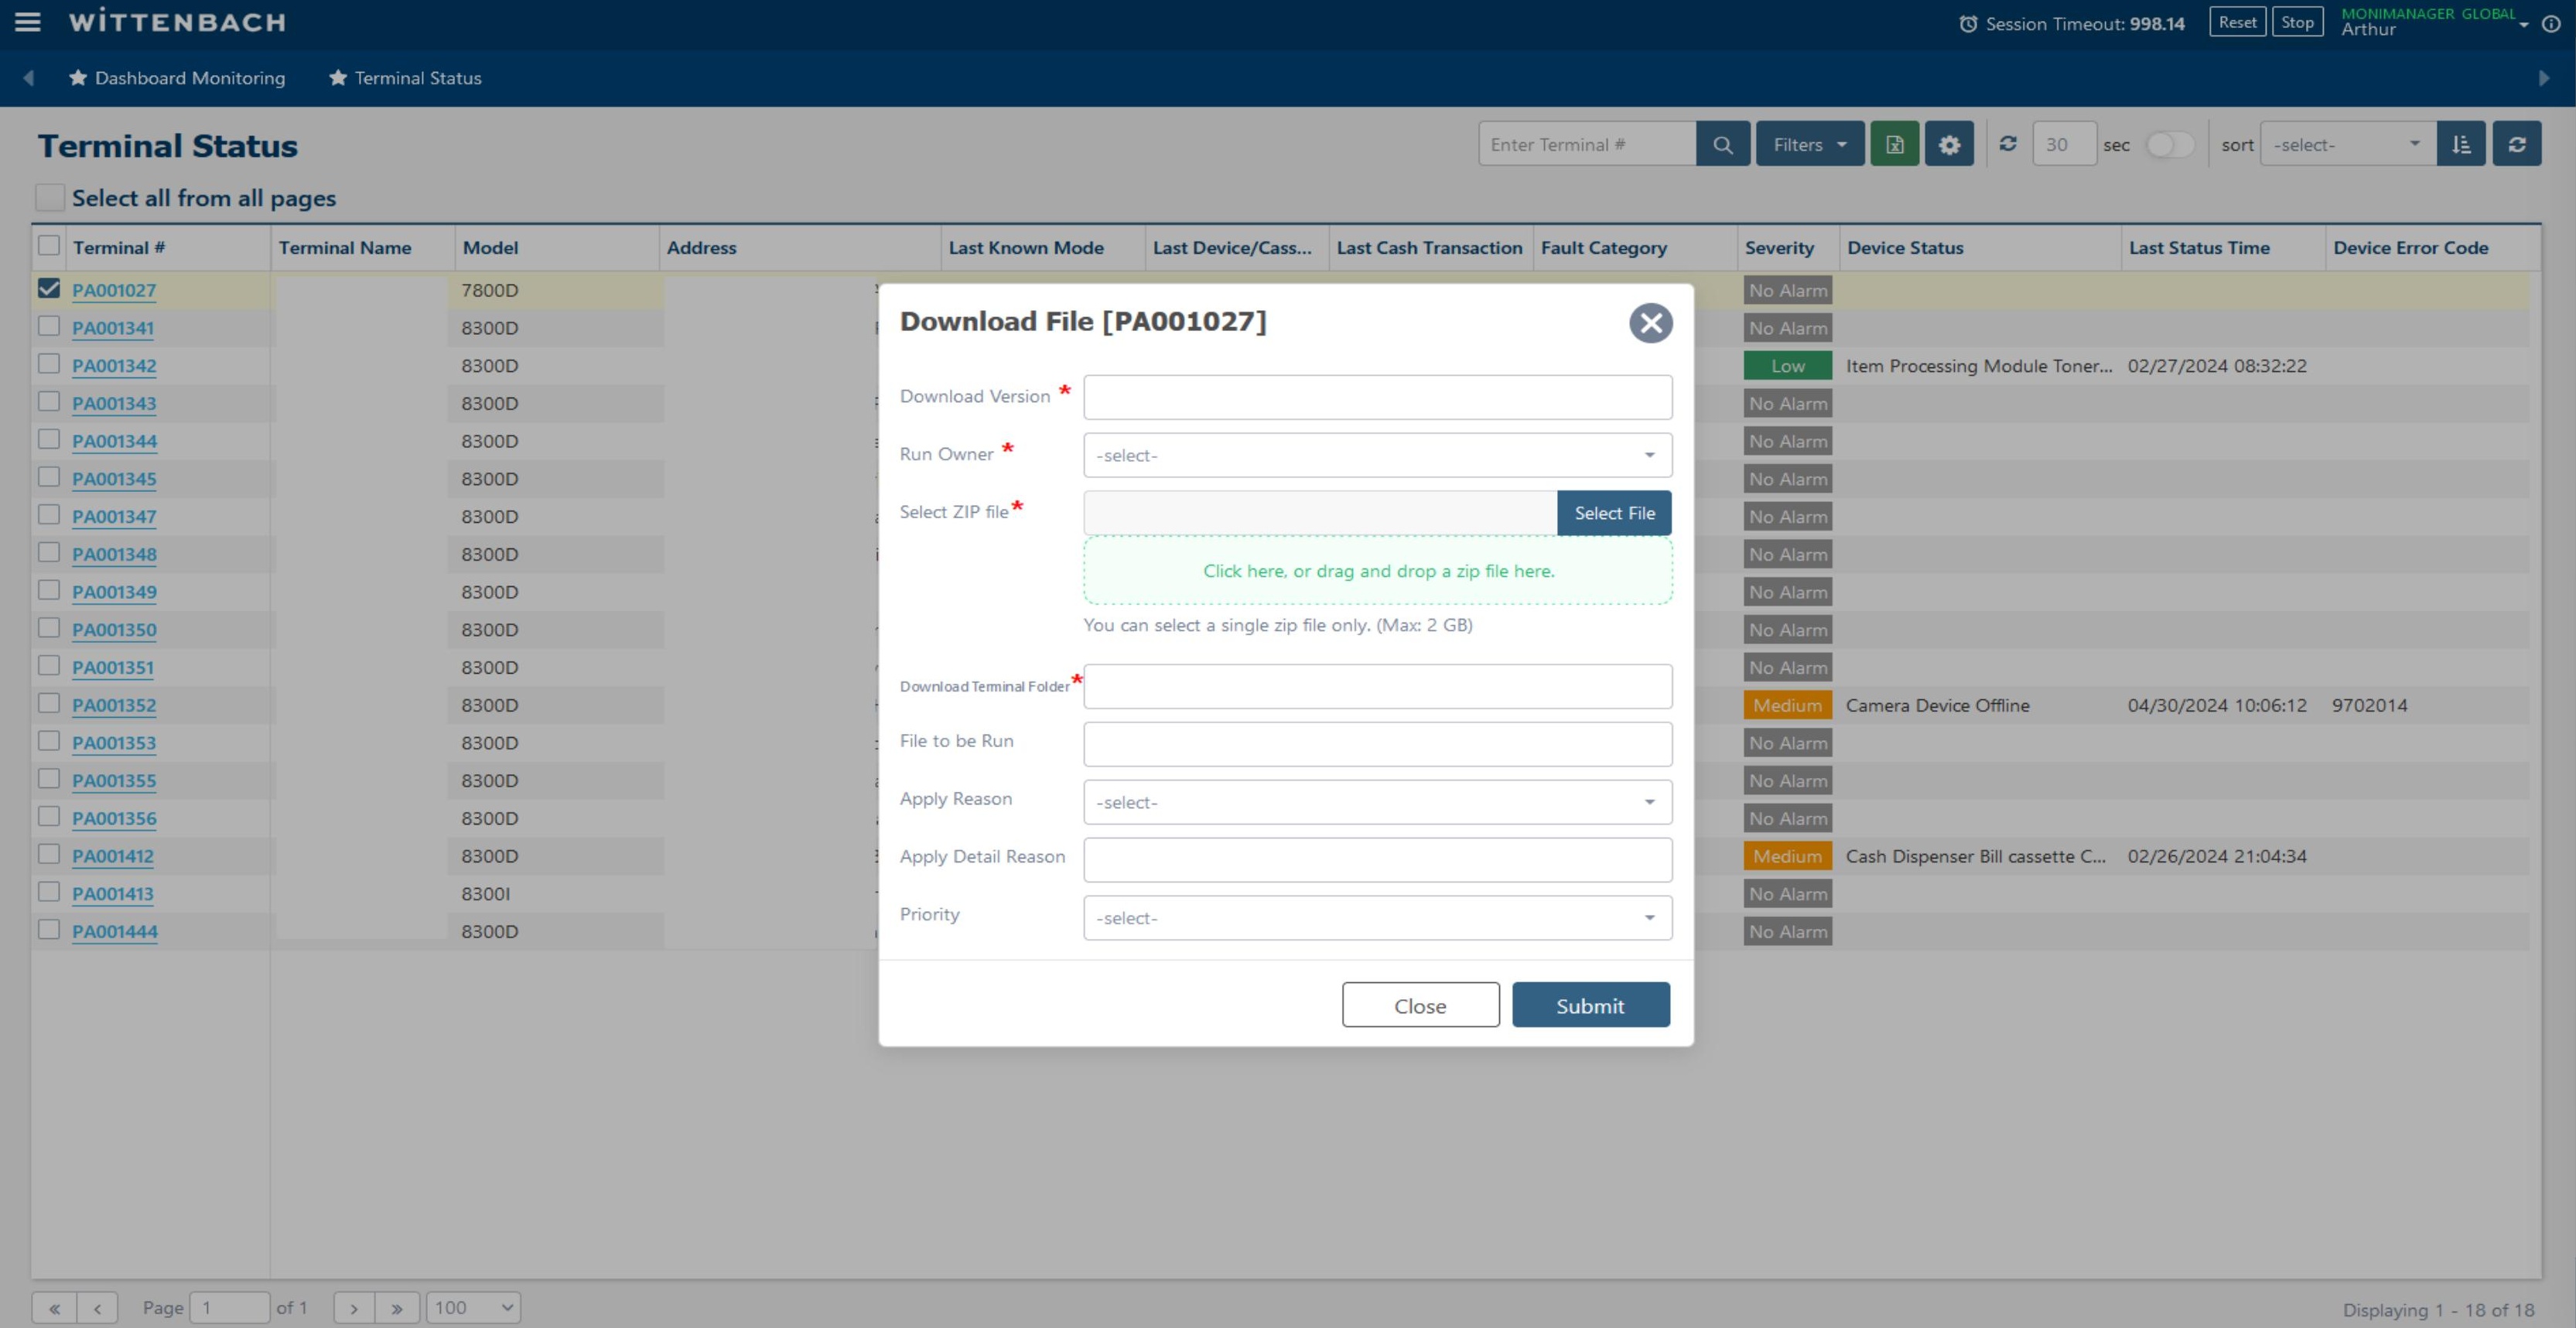
Select Download File from the context menu to push a file (e.g. a patch, config, or software package) from MoniManager to a terminal.
| Field | Description |
|---|---|
| Download Version | Version label for this deployment |
| Run Owner | Select the user context that will run the file |
| Select ZIP file | Upload a ZIP file (max 2 GB) by clicking or drag-and-drop |
| Download Terminal Folder | Destination path on the terminal |
| File to be Run | Name of the executable/script inside the ZIP to launch after extraction |
| Apply Reason | Select the reason category for this deployment |
| Priority | Set job priority level |
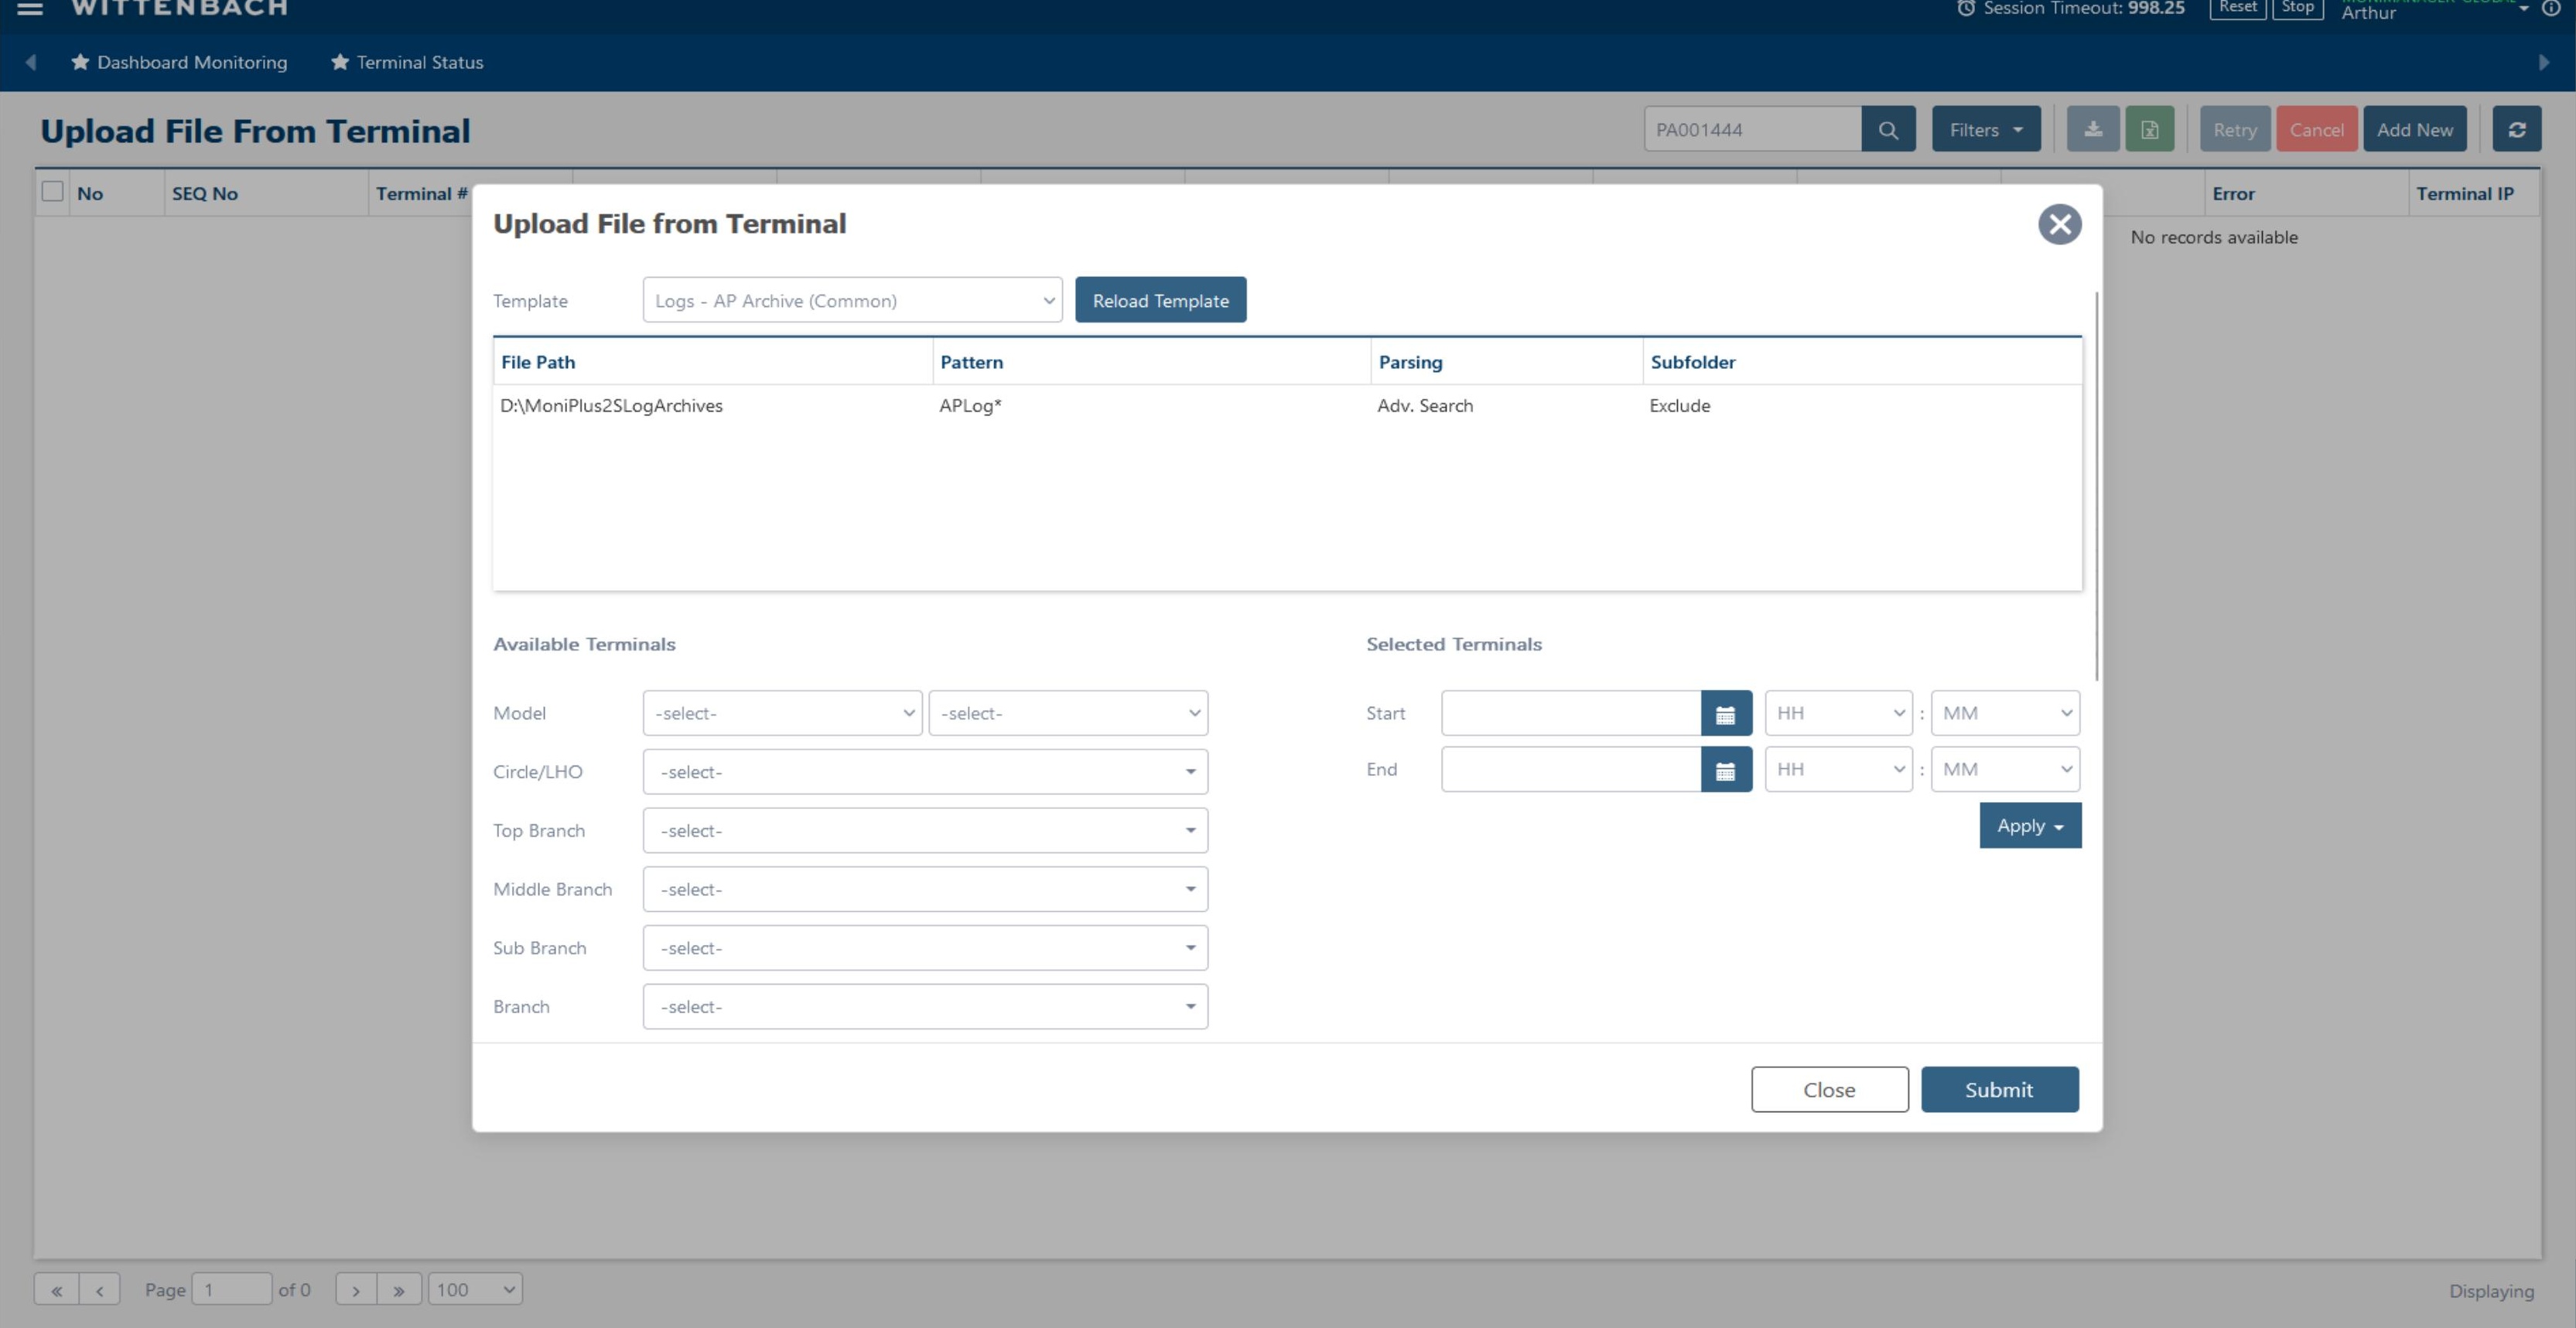
A related function is Upload File from Terminal, accessible from the main navigation menu under Remote Management. This queues a bulk file collection job across multiple terminals at once.
| Field | Description |
|---|---|
| Template | Select a file type template (e.g. Logs – AP Archive) |
| Available Terminals | Filter by Model, Circle/LHO, Branch, etc. |
| Selected Terminals | Set the Start/End date range for file collection |
| Apply button | Populates the terminal list based on filters |
After configuring, click Submit to queue collection jobs for all selected terminals simultaneously.
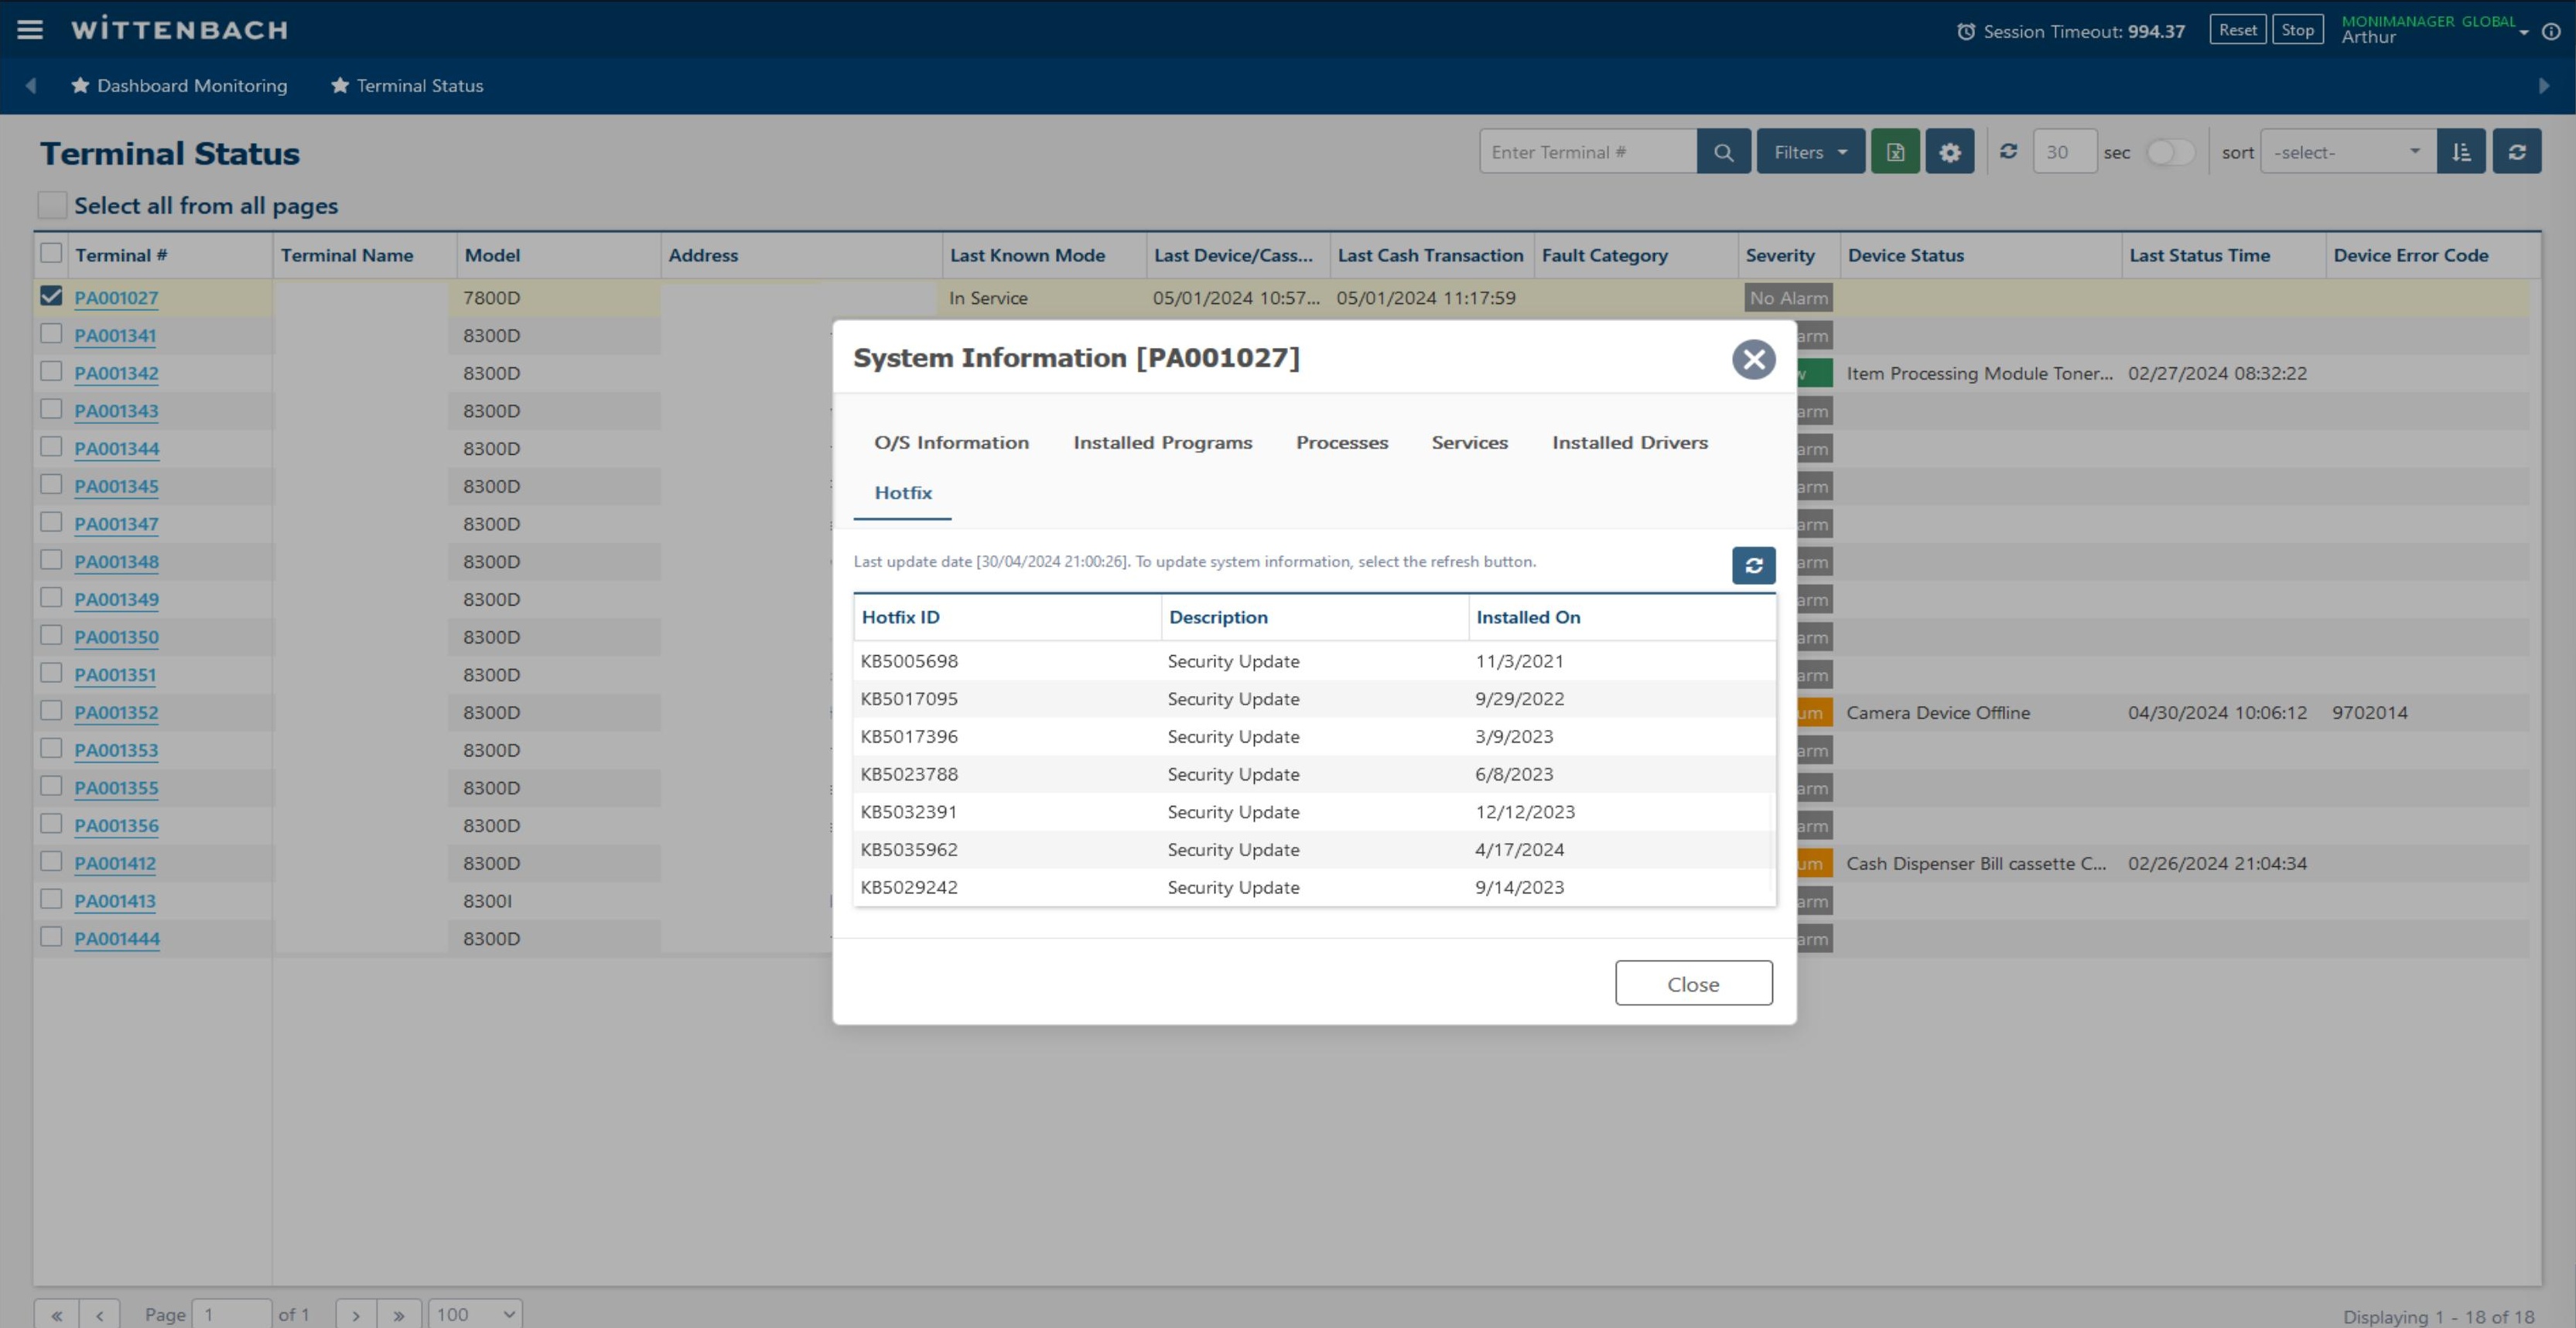
Select System Information from the context menu to open the System Information dialog. It contains five tabs:
| Tab | Contents |
|---|---|
| O/S Information | Windows version, build, architecture, computer name |
| Installed Programs | List of all software installed on the terminal |
| Processes | Running processes and their CPU/memory usage |
| Services | Windows services and their current state (Running/Stopped) |
| Installed Drivers | Hardware driver inventory |
| Hotfix | List of installed Windows patches (KB articles) with install dates |
The Hotfix tab is particularly useful for patch compliance verification — it lists all installed KB security updates and their installation dates.
Click the Refresh (🔄) button to pull the latest data from the terminal.
Navigate to Fault Management → Monitoring → Dashboard Monitoring from the main menu (hamburger icon in top-left), or click the breadcrumb link in the top navigation bar.
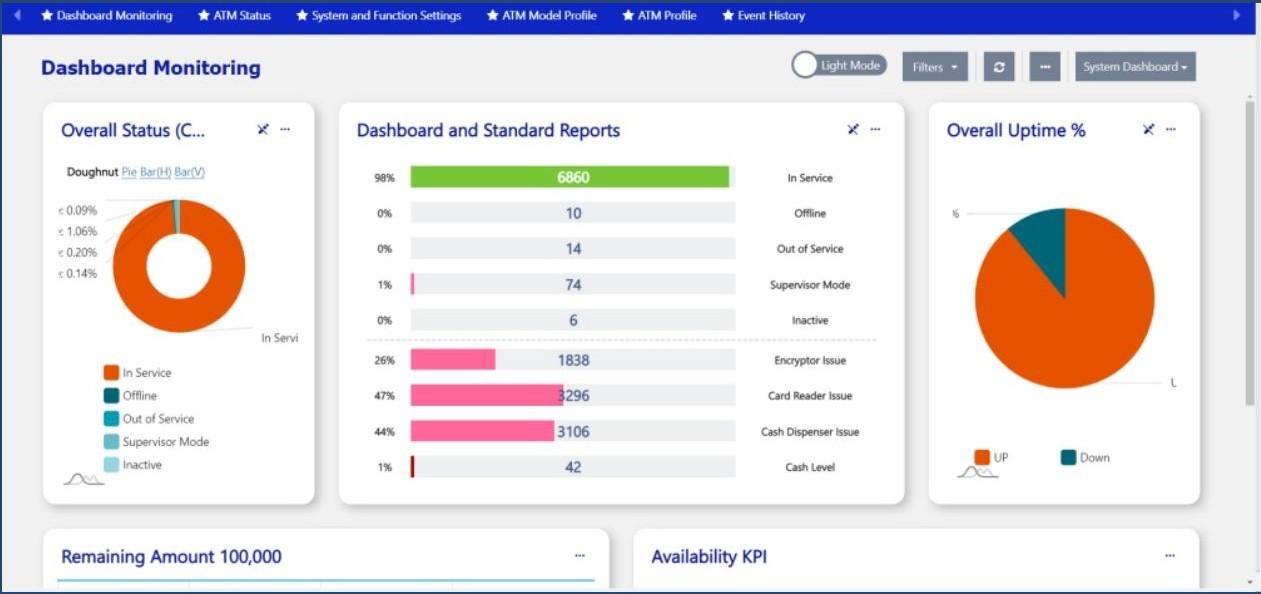
The Dashboard Monitoring page provides a fleet-wide overview with multiple chart widgets. You can toggle between Light Mode and dark mode using the toggle in the top-right corner.
The top two widgets show fleet-level health:
Overall Status (Chart) — A donut chart showing how many terminals are in each state:
Overall Uptime % — Shows the percentage of terminals currently UP vs. Down. Green = UP.
Switch between chart types using the Doughnut / Pie / Bar(H) / Bar(V) links below each chart title.
The dashboard includes additional operational widgets:
| Widget | What it shows |
|---|---|
| Cash Status (Chart) | Distribution of cash states: Cash Out, Cash Low, Cash High, Cash Full, Cash Available |
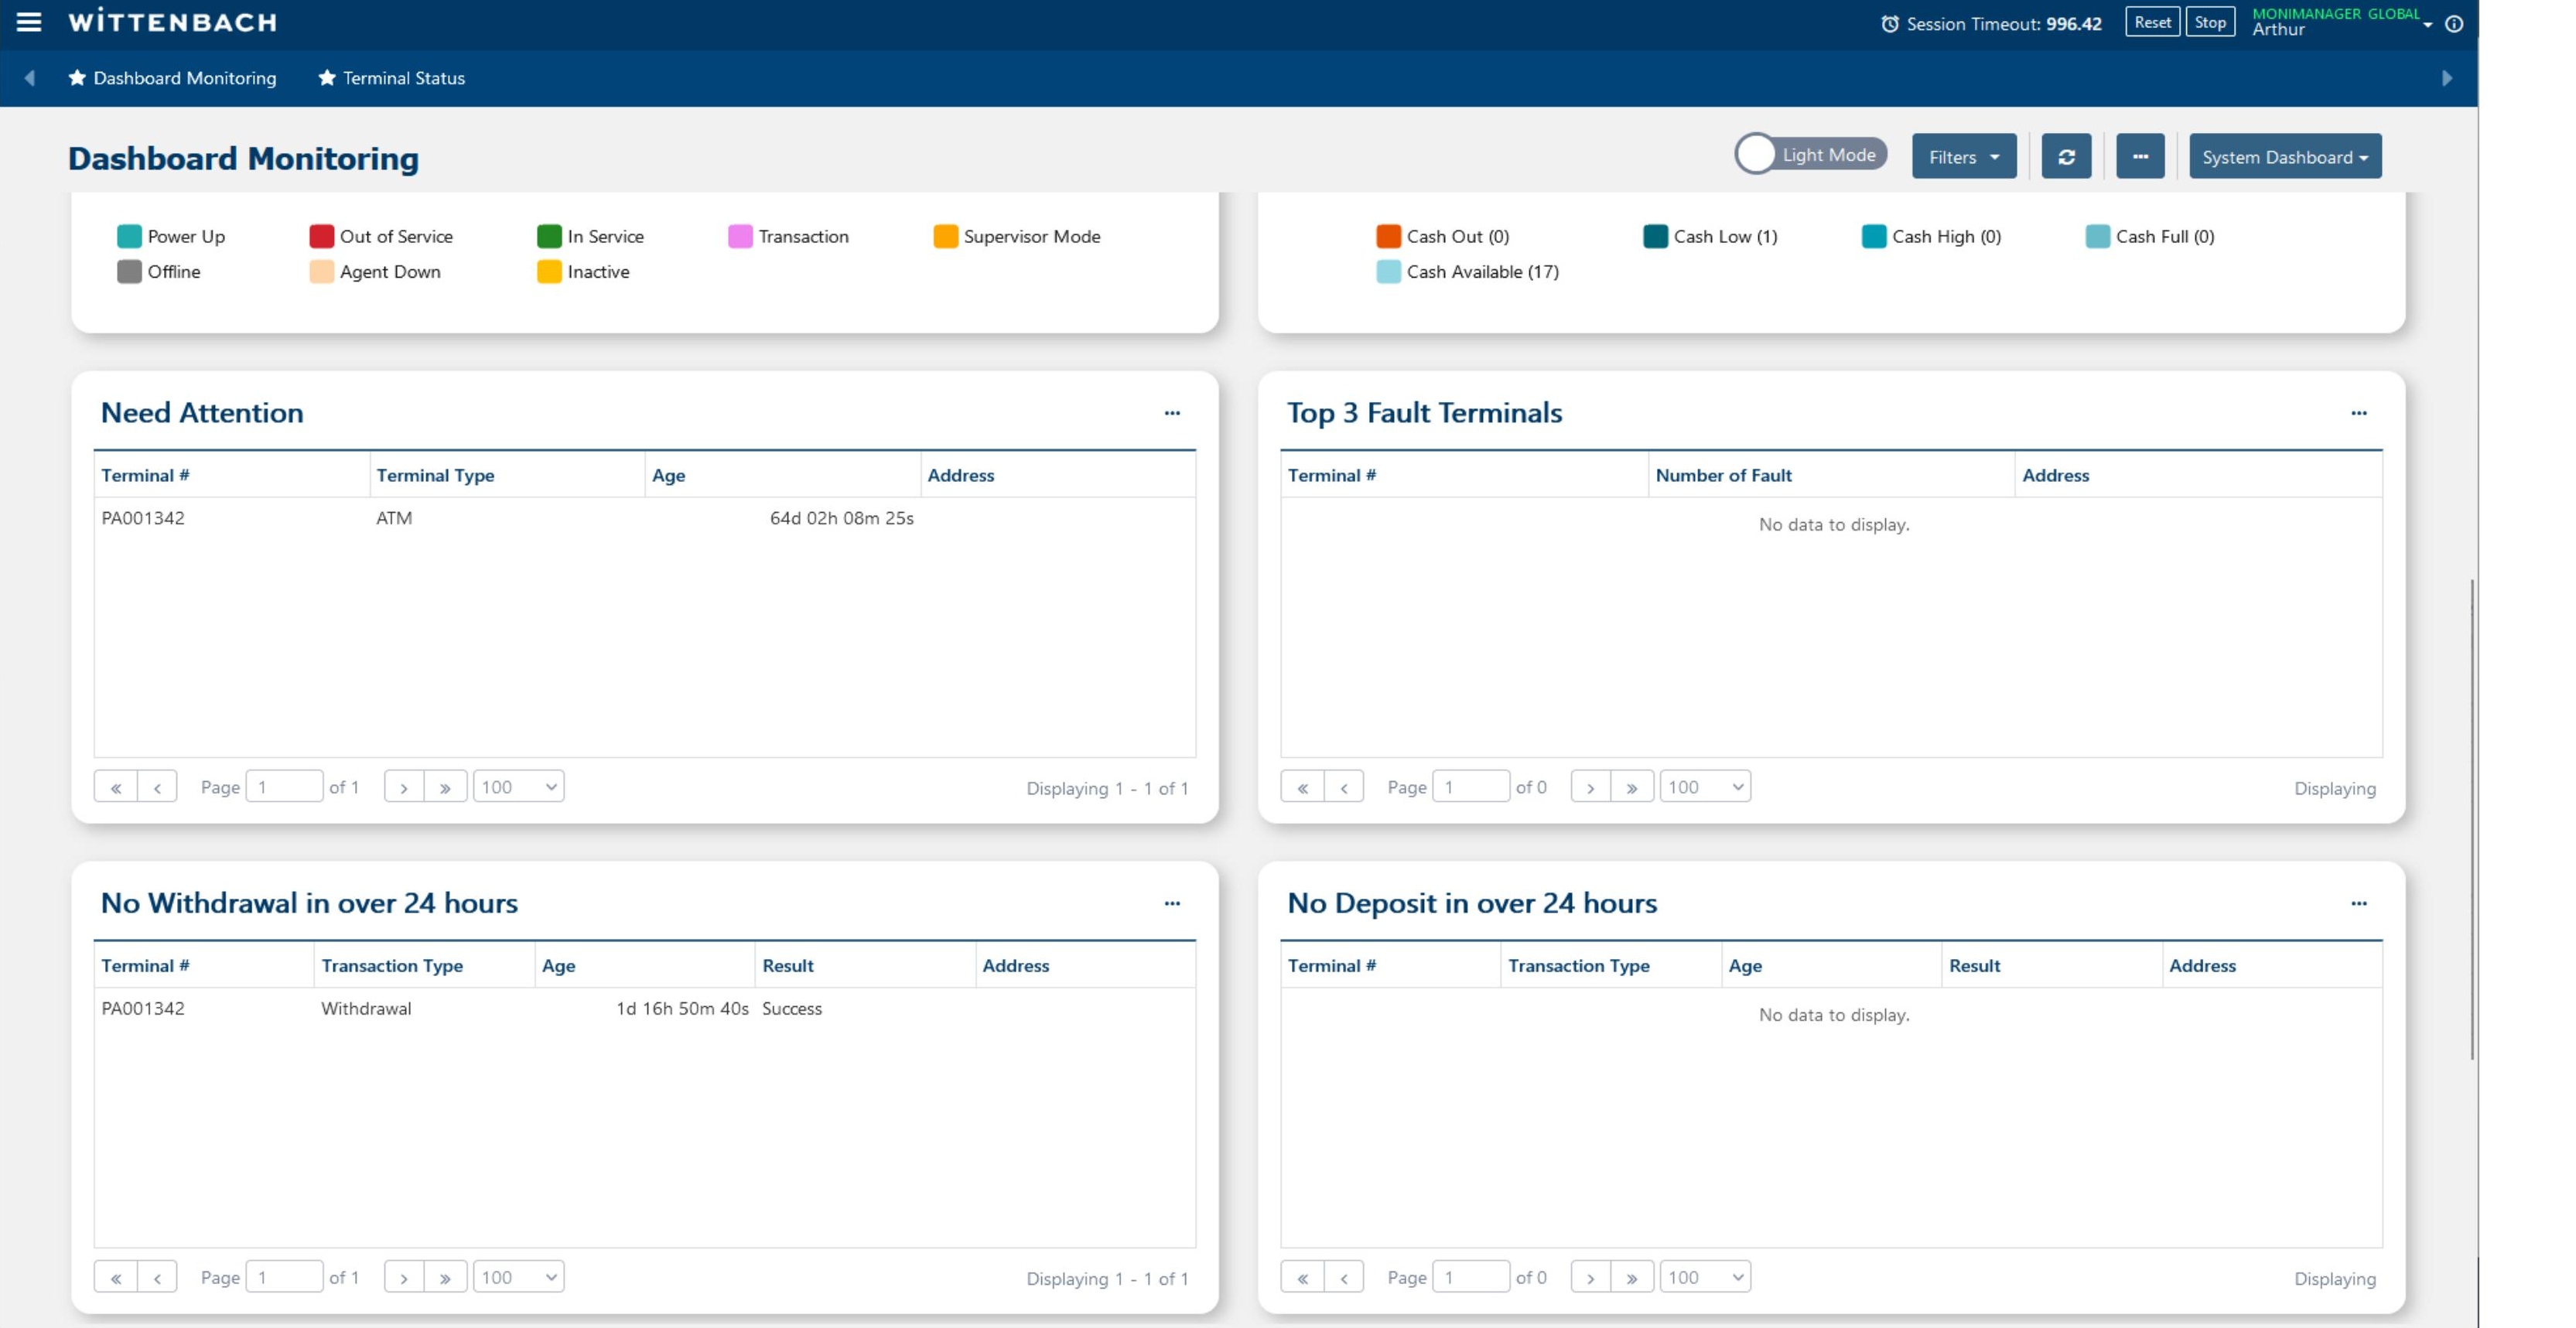
| Need Attention | Terminals with active alerts, showing Terminal #, Type, Age, and Address |
| Top 3 Fault Terminals | Terminals with the most faults, ranked by fault count |
| No Withdrawal in over 24 hours | Terminals that haven't processed a withdrawal — may indicate offline or low traffic |
| No Deposit in over 24 hours | ITMs with no deposit activity |
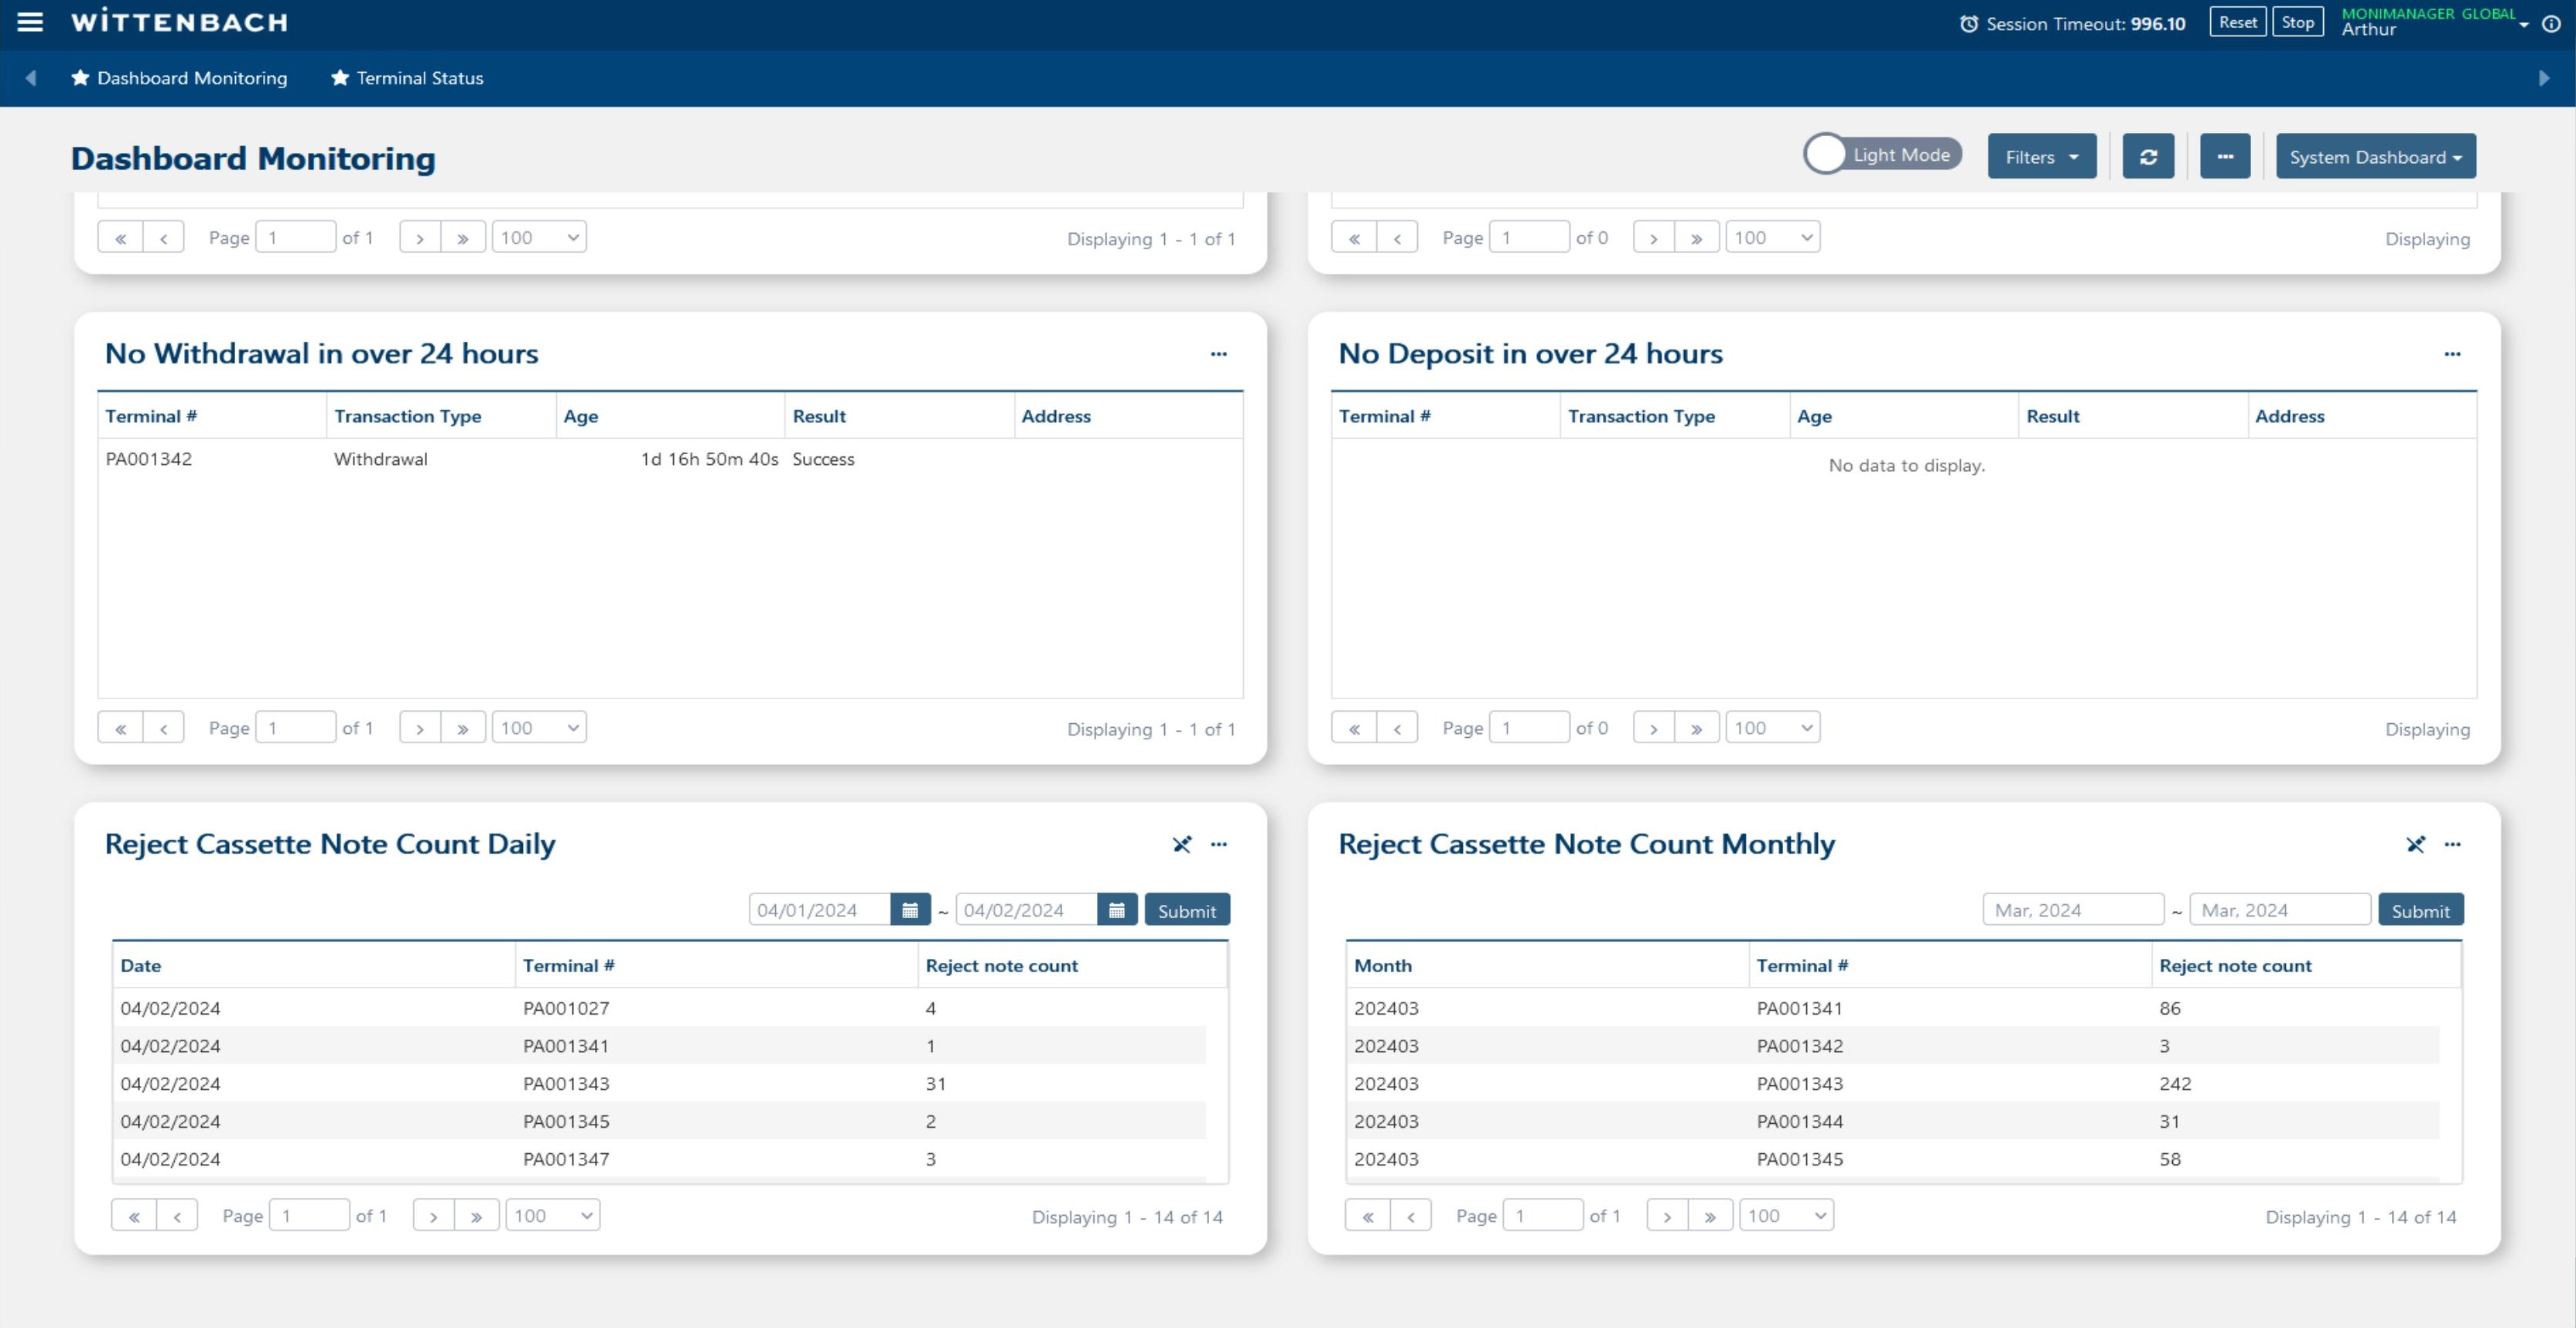
Further down the dashboard you will find two reject cassette tracking widgets:
Reject Cassette Note Count Daily — Shows the number of rejected bills per terminal per day. Use the date range picker to select the period and click Submit.
Reject Cassette Note Count Monthly — Aggregates reject counts by month. Useful for identifying terminals with chronic cash quality or dispenser issues.
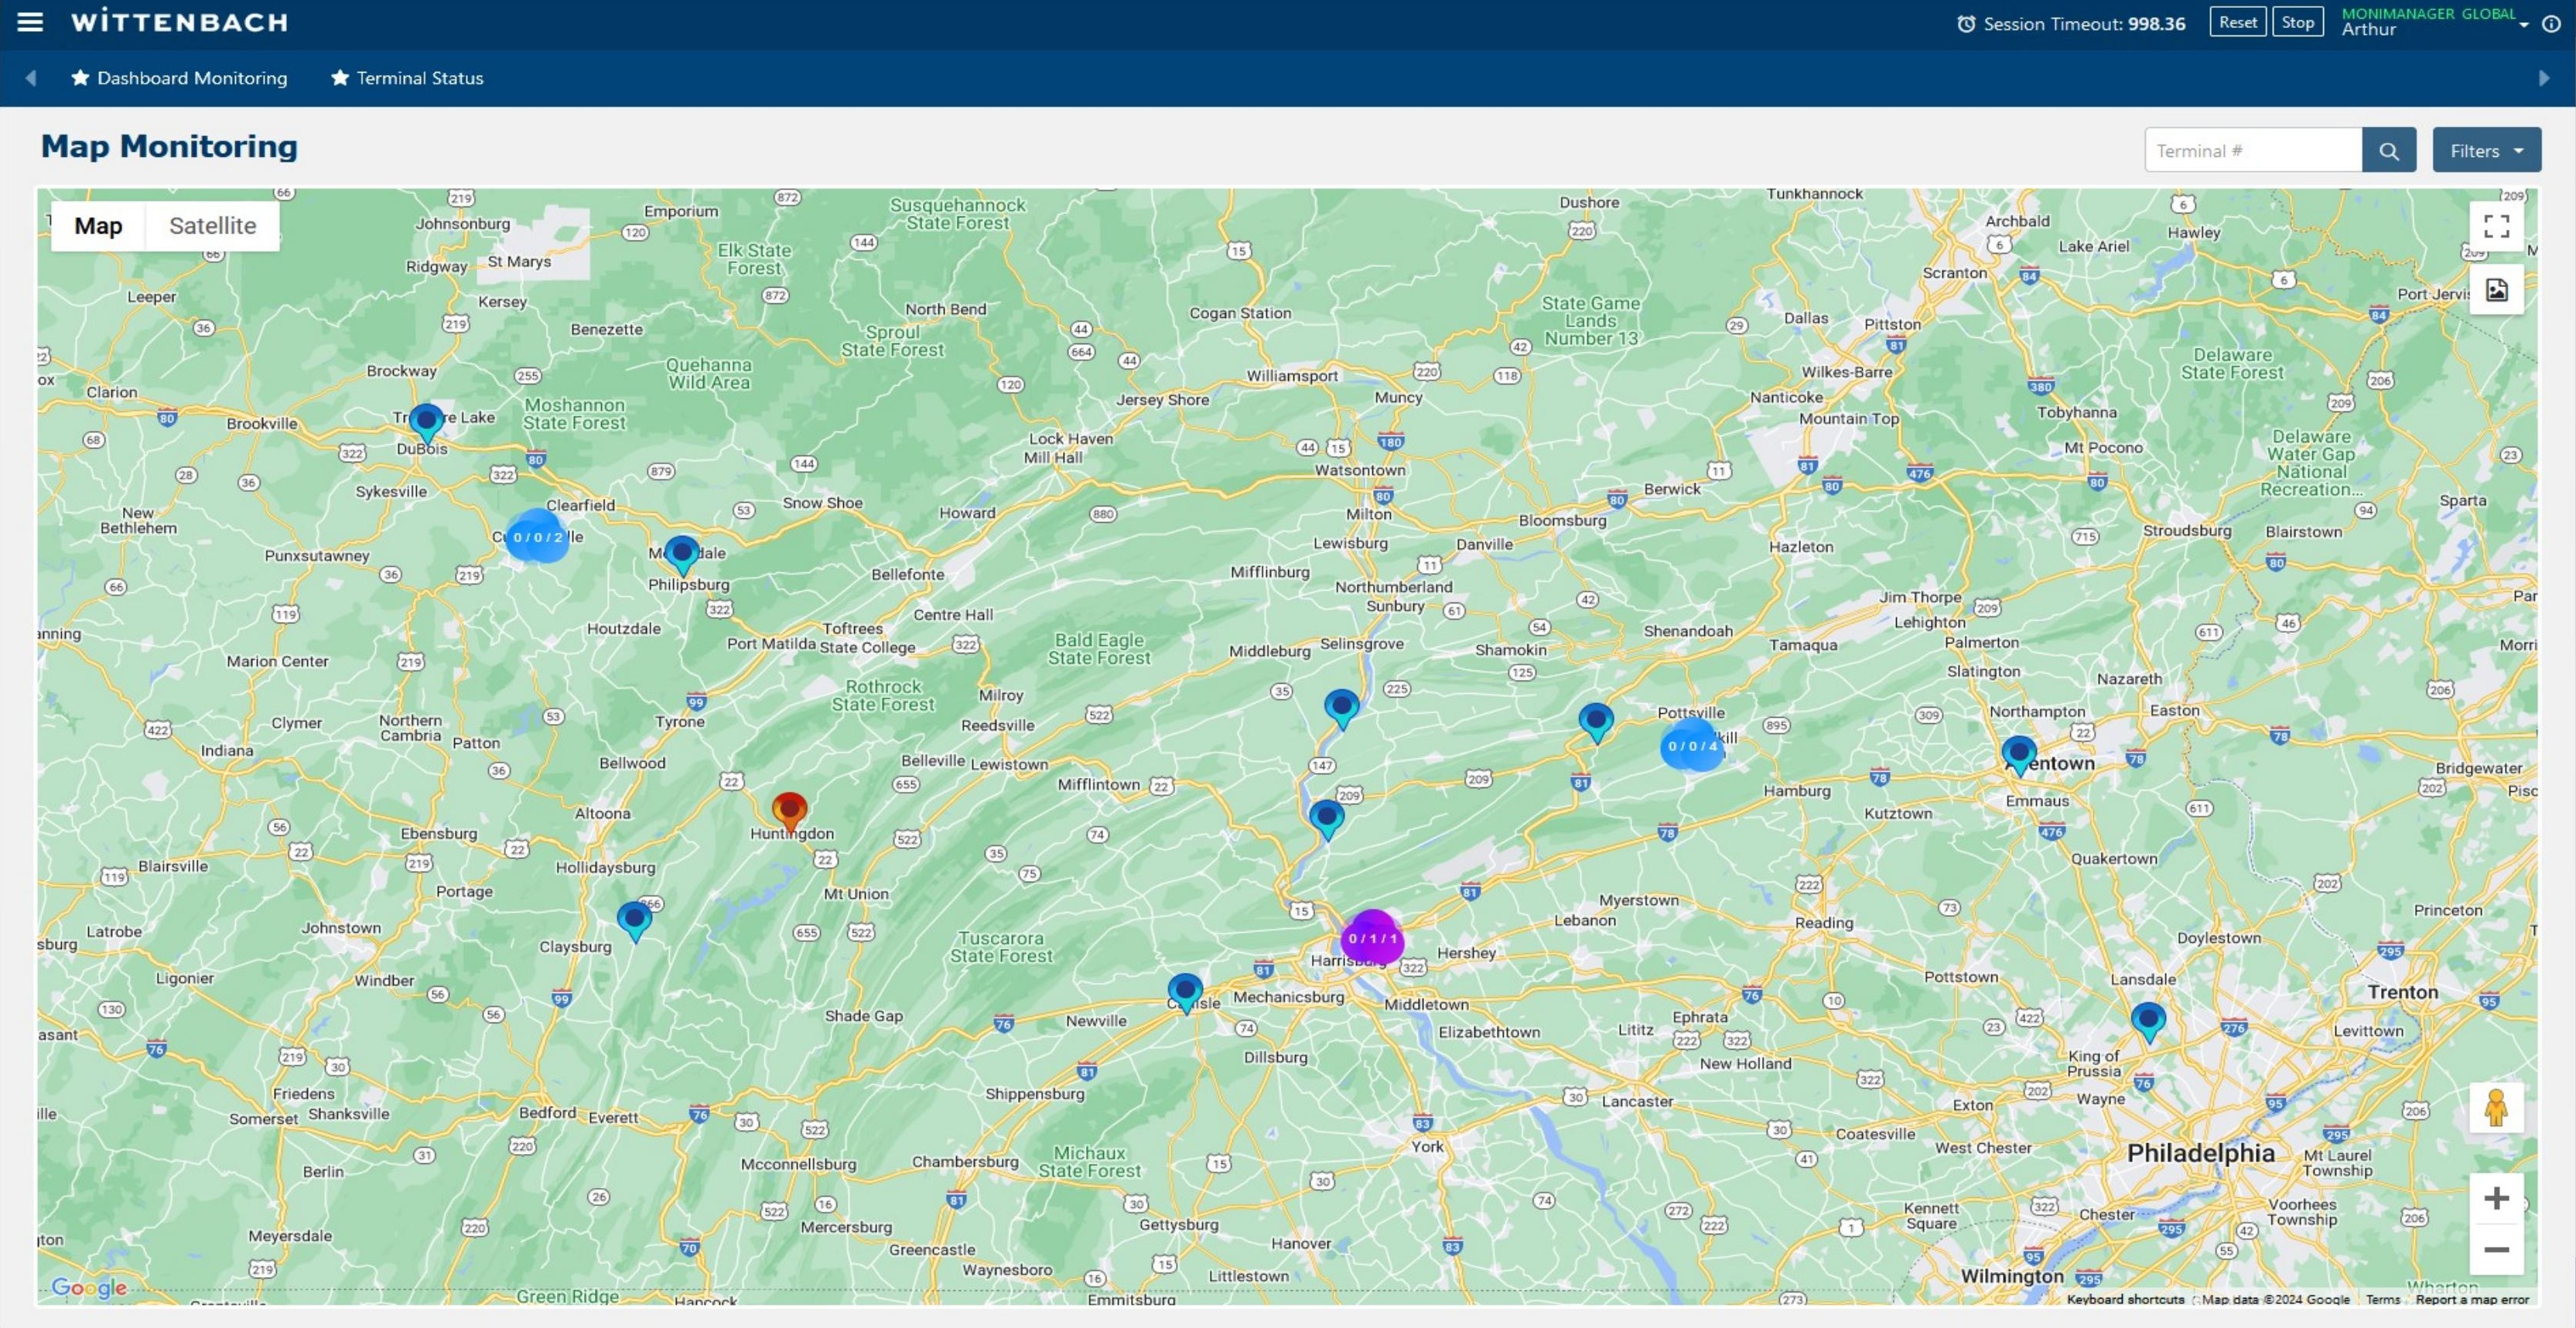
Navigate to Fault Management → Monitoring → Map Monitoring to see all terminals plotted on a Google Map.
Each terminal appears as a colored pin corresponding to its current status (matching the same color codes as the Icon Monitoring and Dashboard views). Clusters of terminals appear as numbered bubbles that expand as you zoom in.
Use the search box to find a specific terminal by number, and the Filters button to filter by status, model, or branch. Toggle between Map and Satellite view using the buttons in the top-left corner of the map.
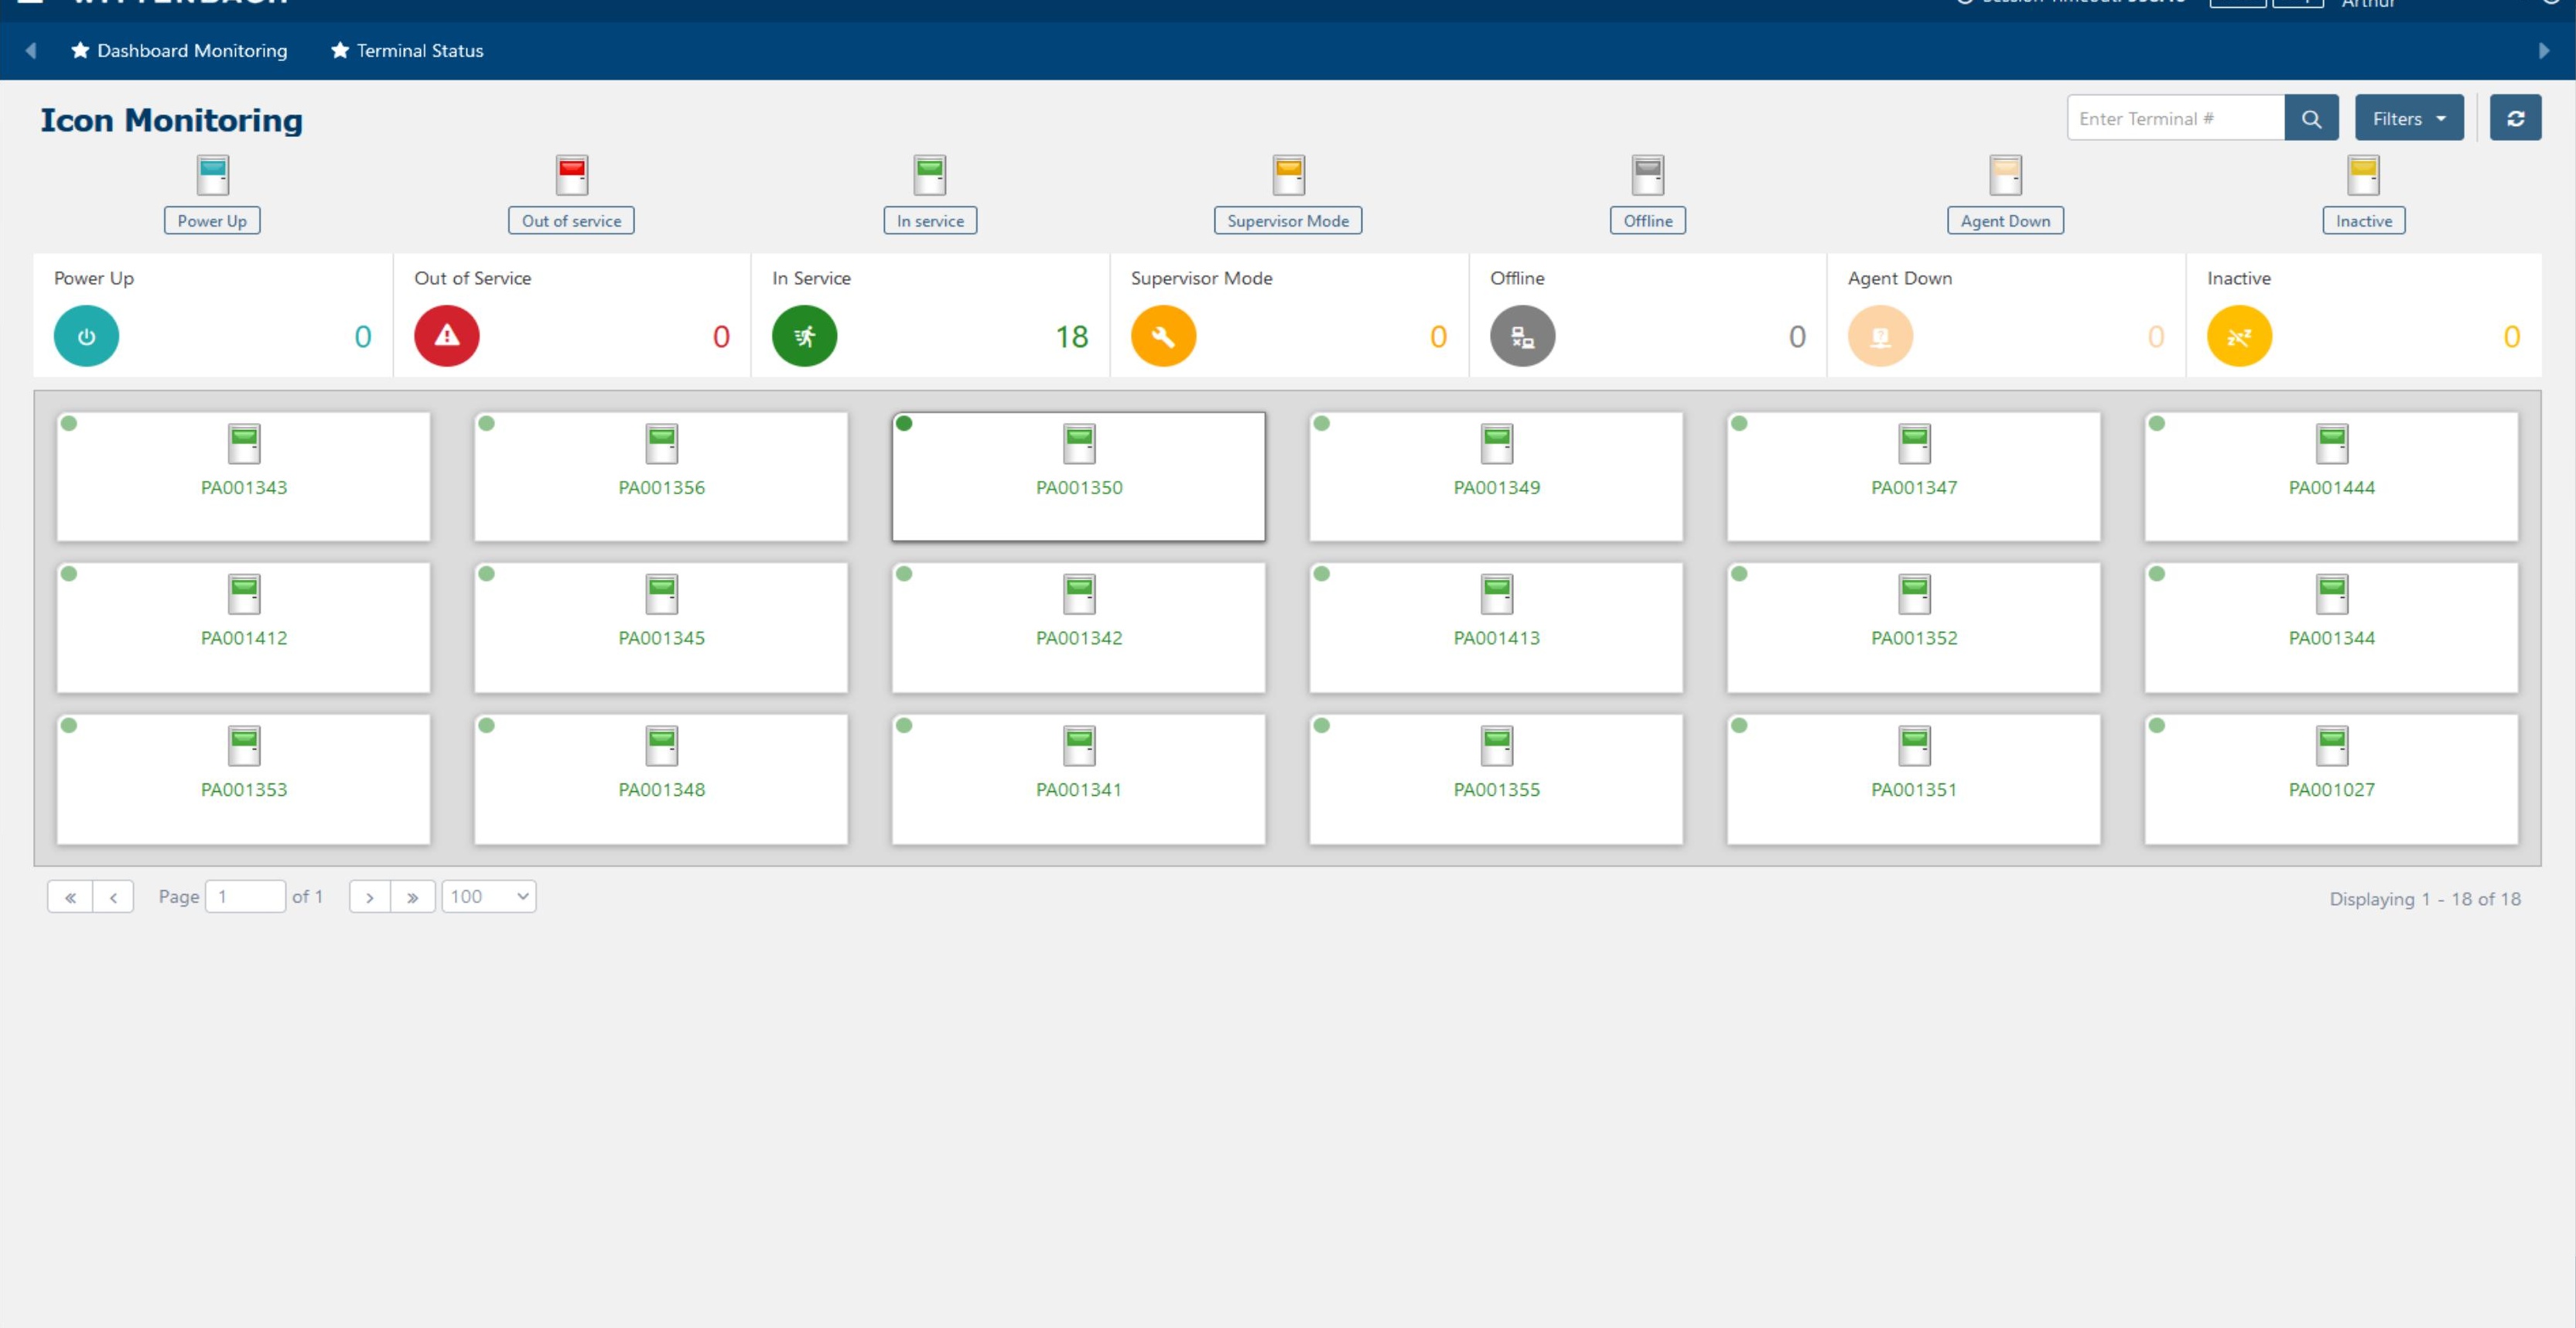
Navigate to Fault Management → Monitoring → Icon Monitoring for a visual tile-based overview of all terminals. Each terminal is displayed as a card with an ATM icon and a status dot.
The top bar shows summary counts by status category:
The small colored dot in the top-left corner of each tile indicates the terminal's status at a glance. Click any tile to navigate to that terminal's detail.
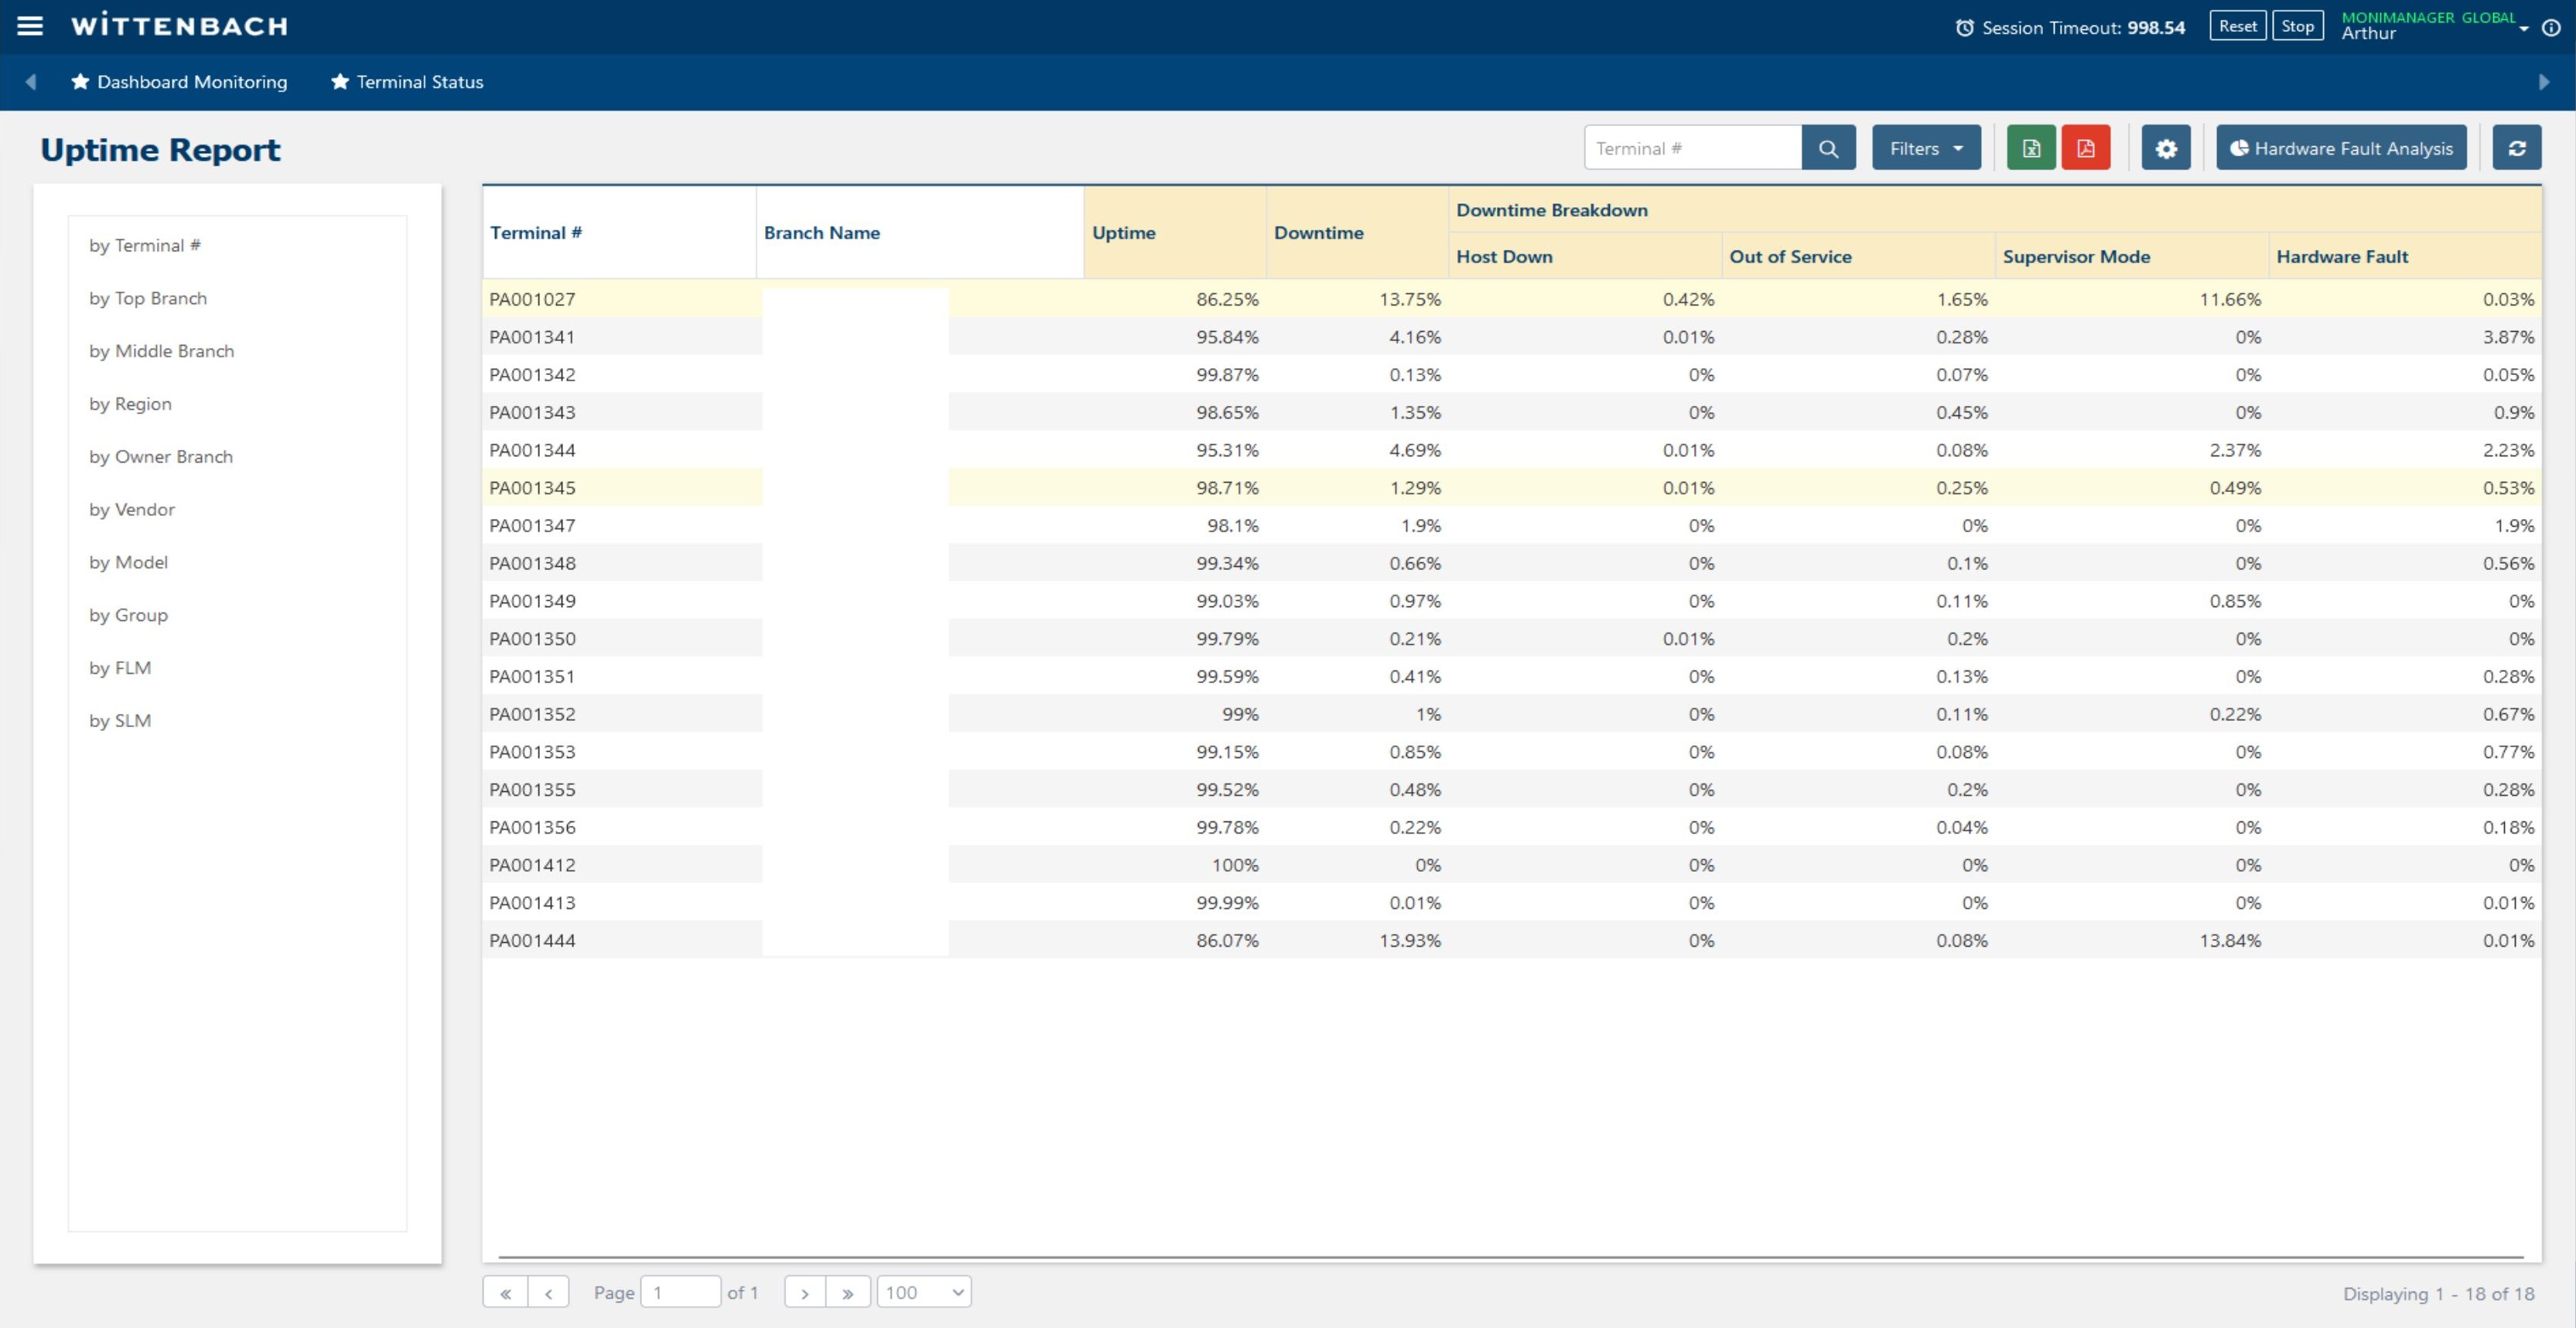
Navigate to Reports and Dashboards → Uptime Report. This report shows availability statistics for all terminals over a selected period.
Use the left panel to switch views: by Terminal #, by Top Branch, by Middle Branch, by Region, by Vendor, by Model, by Group, by FLM, by SLM.
| Column | Description |
|---|---|
| Terminal # / Branch | Identifier for the row |
| Uptime | Percentage of time in service |
| Downtime | Percentage of time unavailable |
| Host Down | Downtime attributed to host/network issues |
| Out of Service | Downtime from software/config OOS events |
| Supervisor Mode | Time in supervisor/maintenance mode |
| Hardware Fault | Downtime attributed to hardware failures |
Use the Filters button and Hardware Fault Analysis button for deeper analysis. Export to Excel using the export icon.
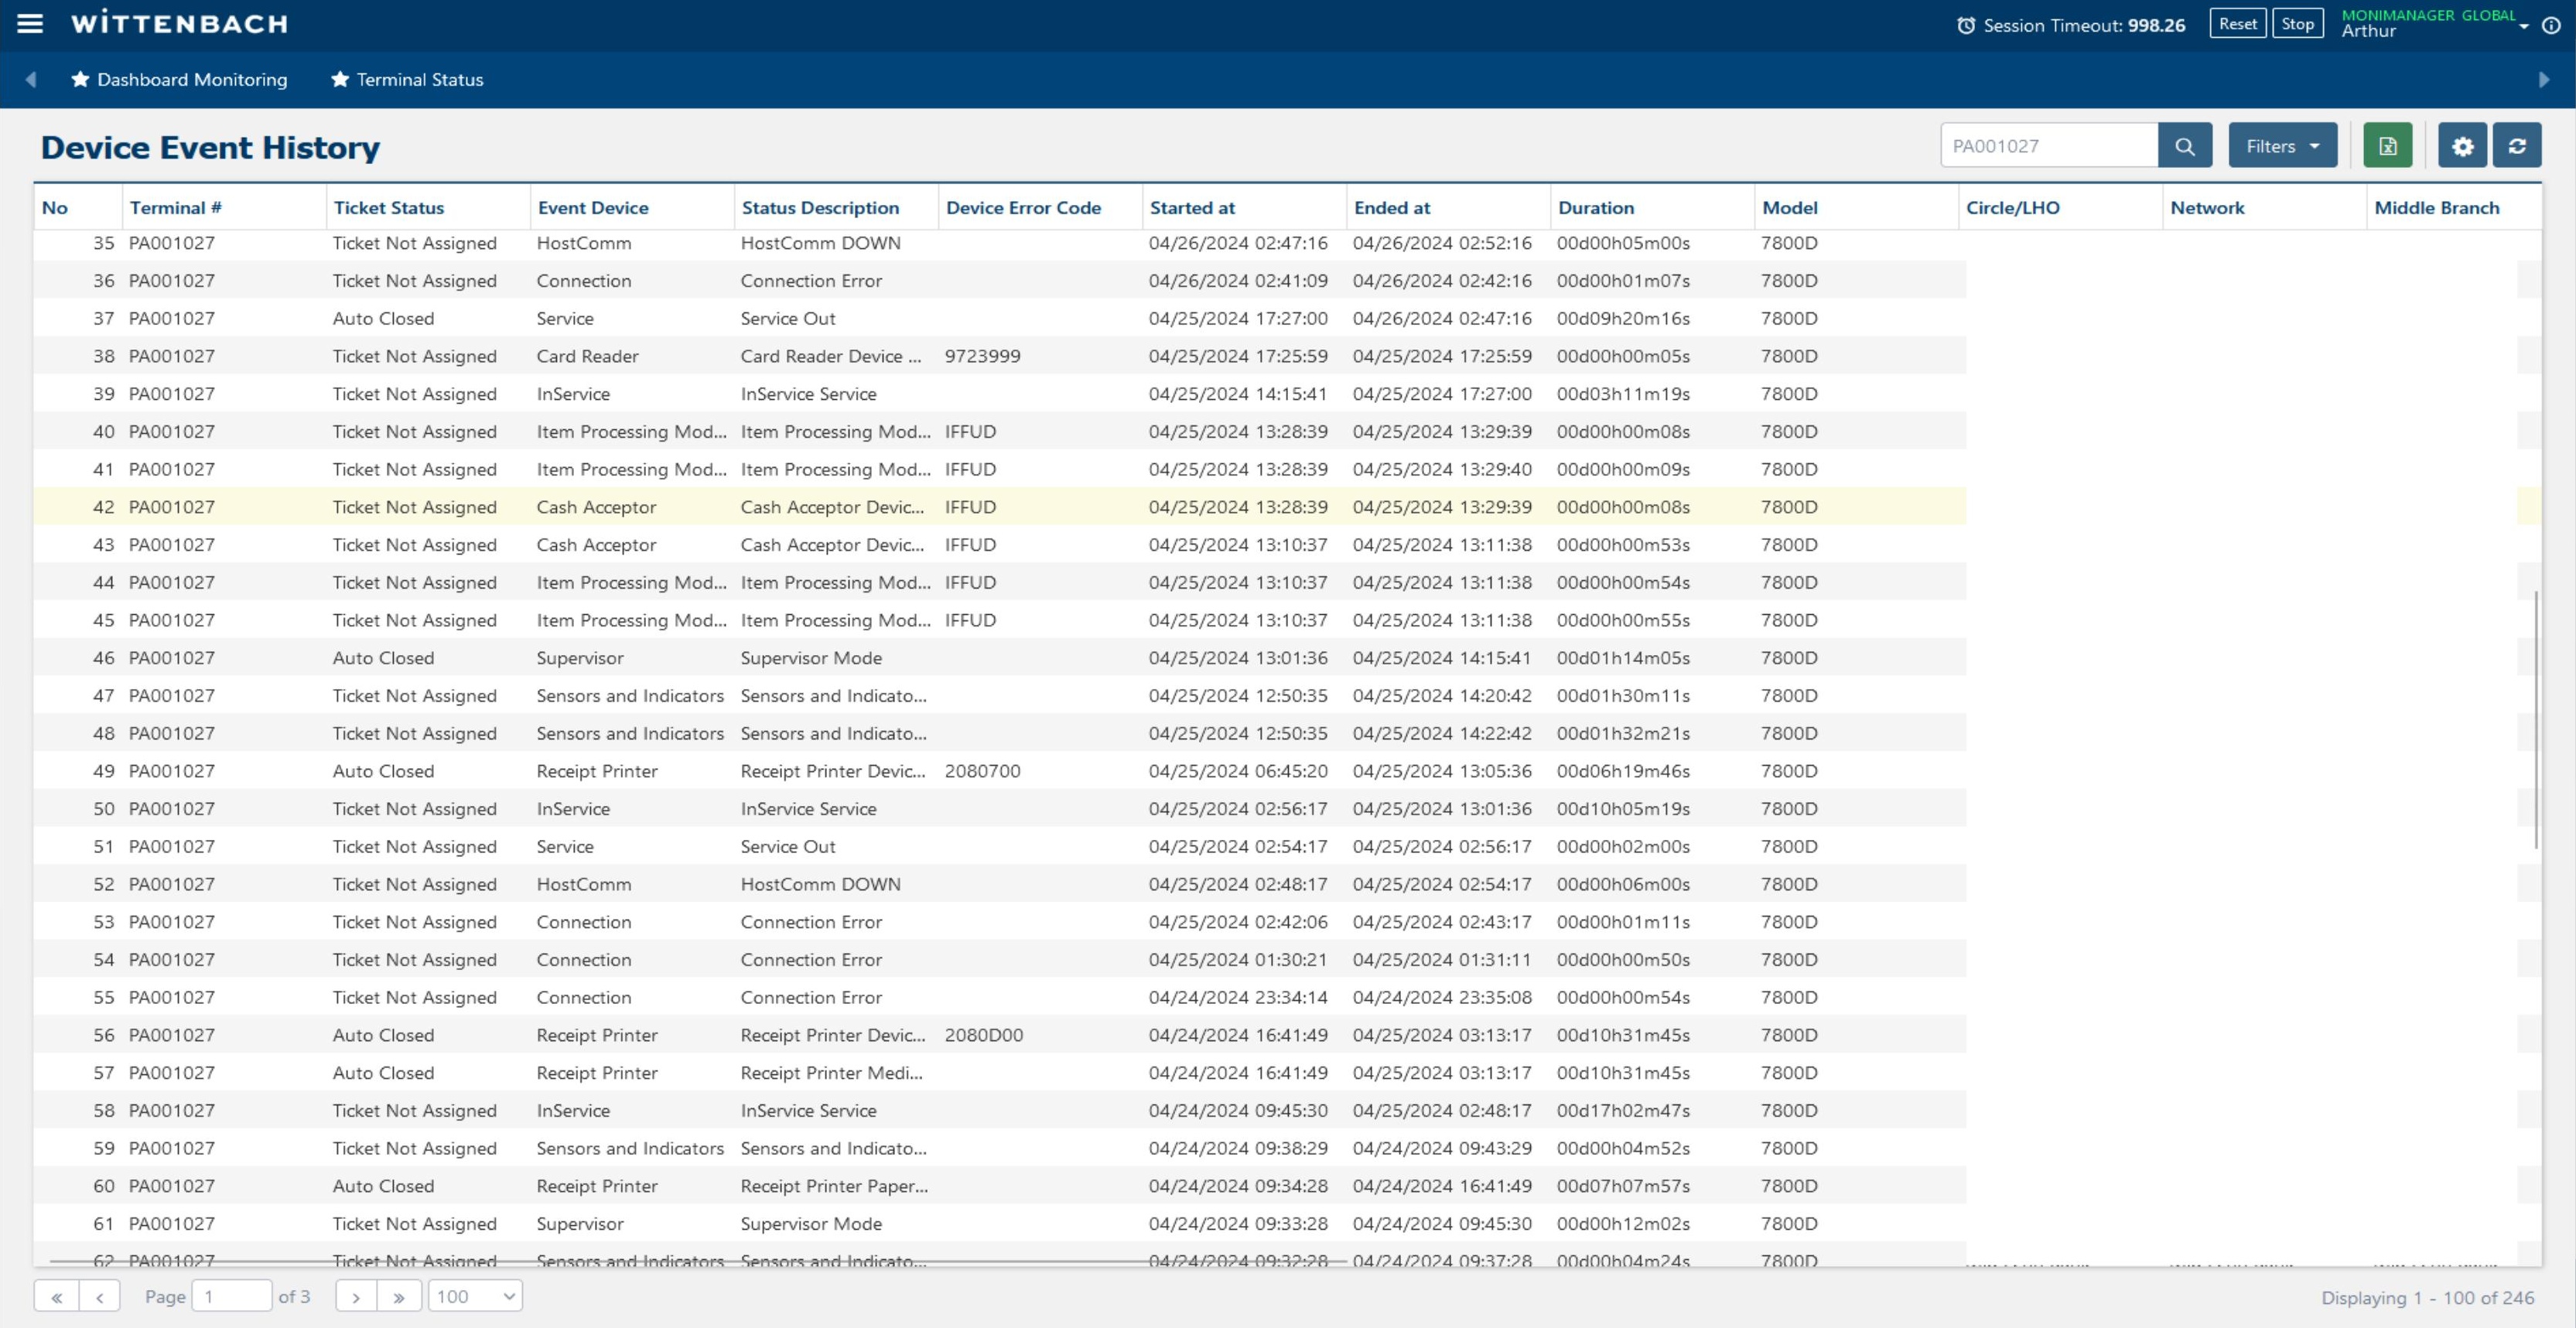
Navigate to Fault Management → Device Event History for a cross-fleet event log. Enter a Terminal # in the search box to filter, or leave blank to see all terminals.
Columns include: No, Terminal #, Ticket Status, Event Device, Status Description, Device Error Code, Started/Ended at, Duration, Model, Circle/LHO, Network, and Middle Branch.
This view is useful for fleet-wide fault pattern analysis and escalation management.
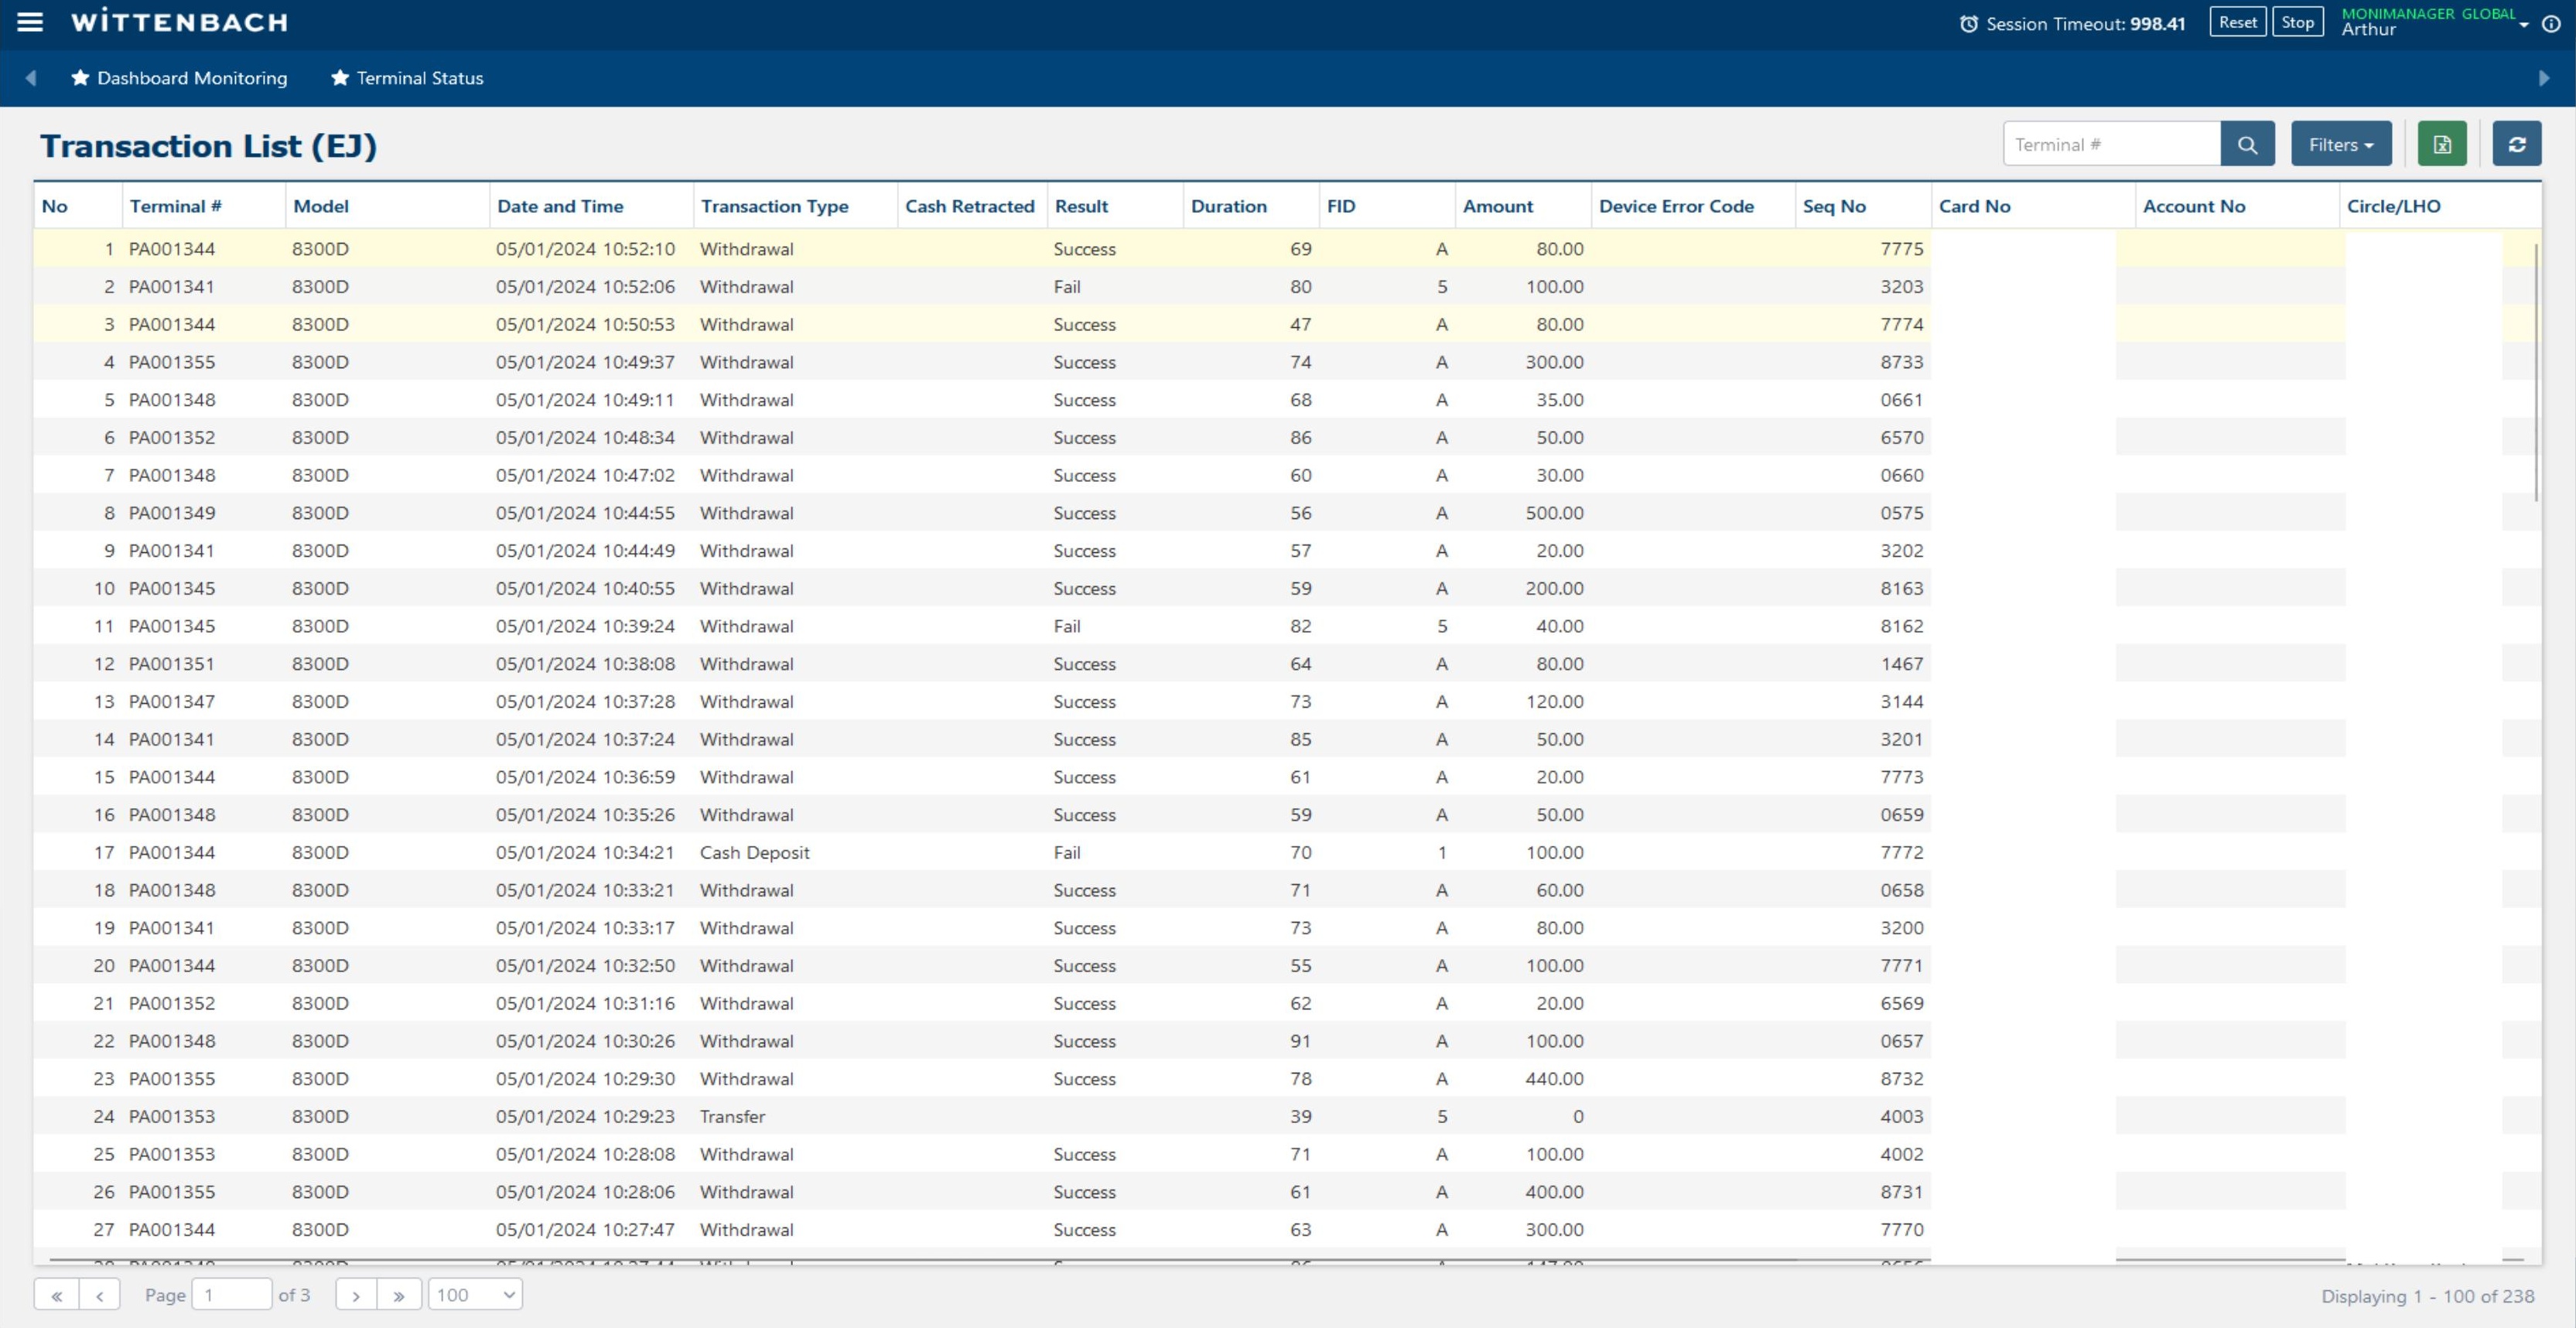
Navigate to Journal and Transaction → Transaction Analysis → Transaction List (EJ) for a fleet-wide transaction view.
| Column | Description |
|---|---|
| No | Sequential number |
| Terminal # | ATM ID |
| Model | Hardware model |
| Date and Time | Transaction timestamp |
| Transaction Type | Withdrawal, Cash Deposit, Transfer, etc. |
| Cash Retracted | Whether dispensed cash was retracted (not taken) |
| Result | Success or Fail |
| Duration | Transaction duration in seconds |
| FID | Financial Institution ID |
| Amount | Dollar amount |
| Device Error Code | Error code if transaction failed |
| Seq No / Card No | Sequence and masked card number |
Use Filters to narrow by date range, terminal, transaction type, or result. Export to Excel for dispute research or reporting.
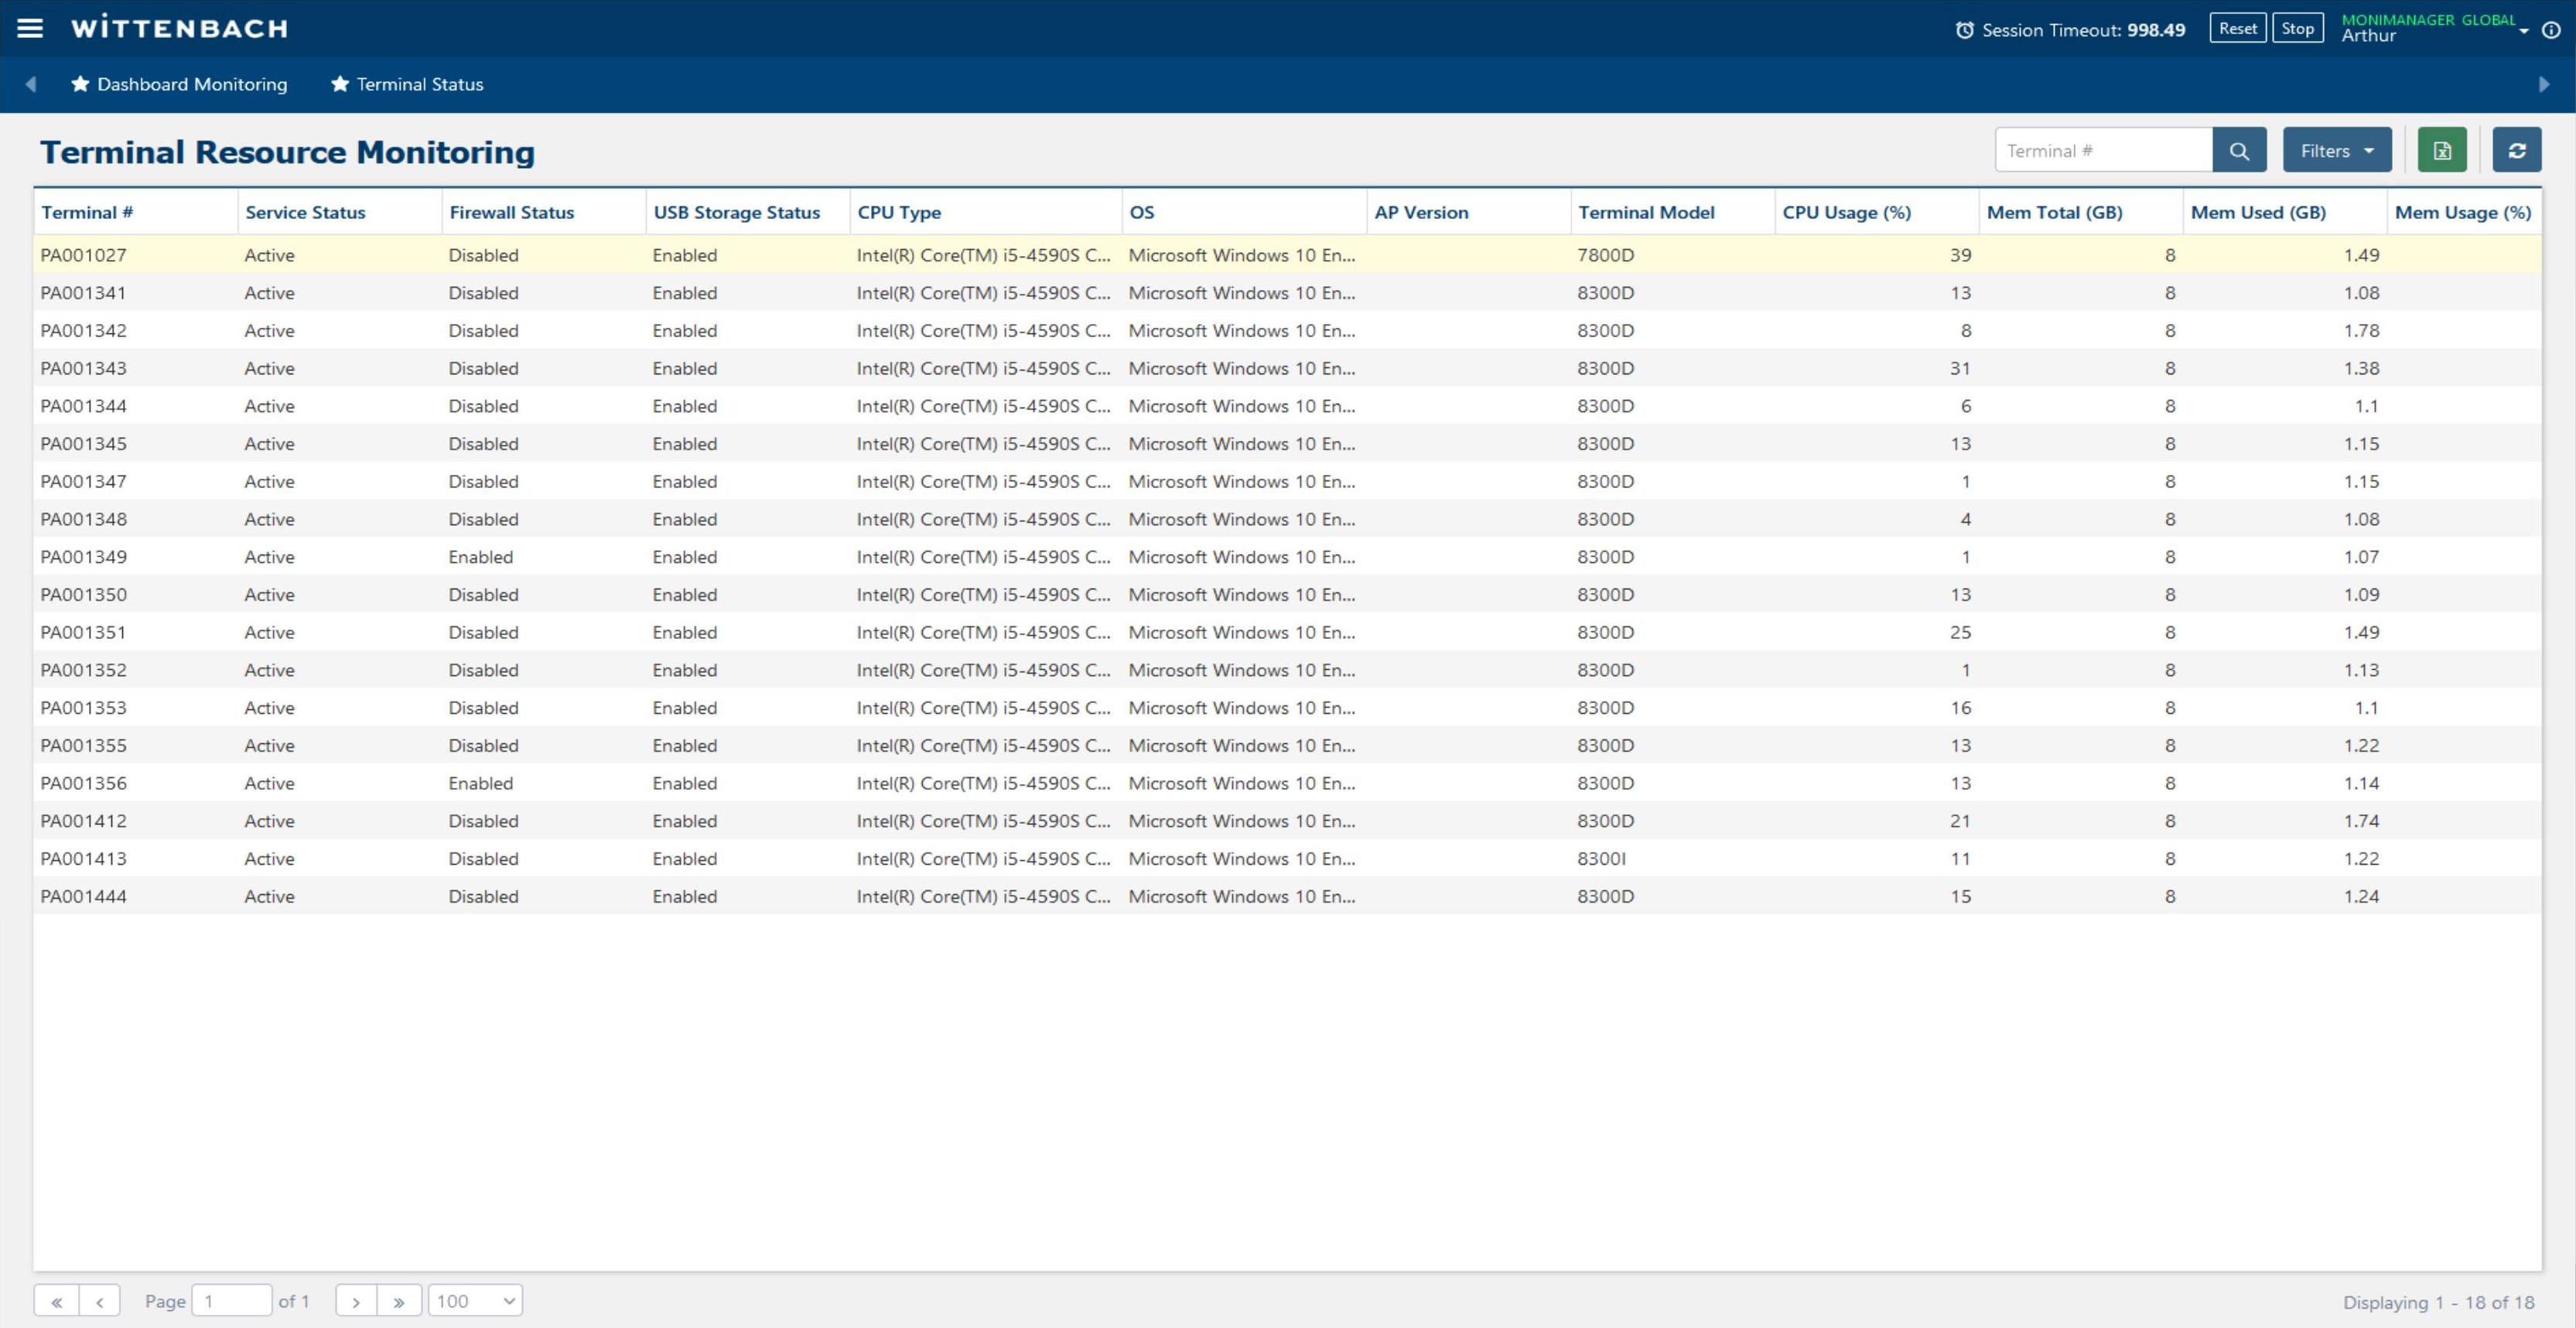
Navigate to Fault Management → Monitoring → Terminal Resource Monitoring to see a fleet-wide table of hardware and OS information for all terminals.
| Column | Description |
|---|---|
| Terminal # | ATM identifier |
| Service Status | Active / Inactive |
| Firewall Status | Enabled / Disabled |
| USB Storage Status | Enabled / Disabled (security posture) |
| CPU Type | Processor model (e.g. Intel Core i5-4590S @ 3.00GHz) |
| OS | Operating system (e.g. Microsoft Windows 10 Enterprise 2016 LTSB) |
| AP Version | Installed application version |
| Terminal Model | Hardware model |
| CPU Usage (%) | Current CPU load |
| Mem Total (GB) / Mem Used (GB) / Mem Usage (%) | Memory statistics |
Some changes require a database update that takes a few moments, and browser caching or online web traffic can prevent the page from immediately reflecting updates.
Workarounds (try in order):
- Click the Refresh icon (🔄) in the top-right corner of the content page
- Press F5 to reload the Chrome browser
- Log out of the current session and log back in
Most history and list pages in BlueVerse (EJ Pulling History, Upload File from Terminal, Device Event History, etc.) automatically set the date filter to today when first opened. If no records were created today, the page will appear empty.
Similarly, the Uptime Report defaults to "yesterday" because today's operation hours are incomplete. To view older data, use the Filter and set a date range that excludes today.
The Terminal Status page is designed to show Active service status terminals only. Terminals with Inactive, Configured, or Terminated service status will not appear in the list.
If the page is empty or a terminal you expect to see is missing:
- Verify the terminal's service status in Asset Profile Management → Terminal Assets → Terminal Profile
- Confirm the terminal has successfully communicated with the BlueVerse server at least once since installation
- Check your user permission — your account may be restricted to a specific terminal set
Occasionally the right-click context menu on the Terminal Status grid won't appear, or it appears empty/incomplete. This typically happens when Chrome's JavaScript execution is running slowly due to browser performance.
Fix: Press F5 to refresh the page. In most cases the context menu will return to normal. If the problem persists in your session, log out, wait a moment, and log back in.
BlueVerse blocks most special characters in text input fields to prevent web security risks (SQL injection, cross-site scripting). Prohibited characters include - + / ! @ # % ^ & * and others.
If a field rejects your input:
- Write out abbreviations in full — e.g. use hardware instead of H/W, or cannot instead of can't
- Email address fields permit the
@character as an exception - Phone number fields permit
-as a separator